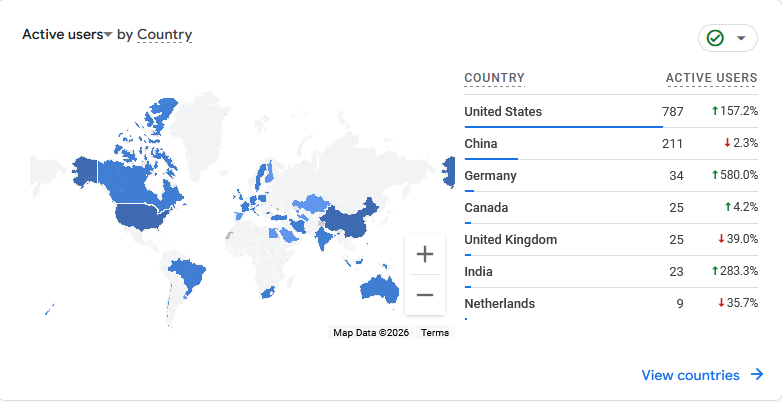
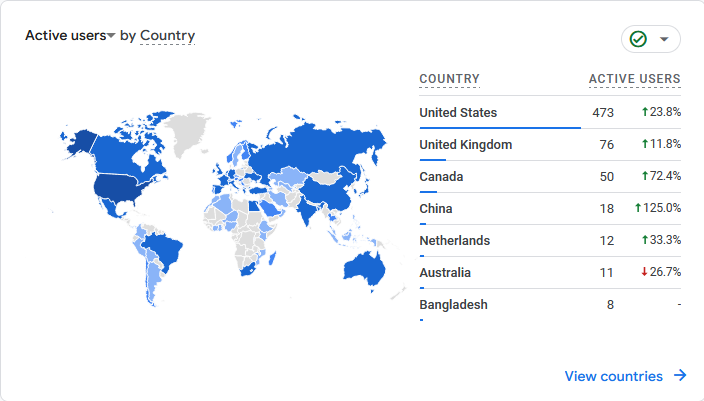
There were 2052 sessions by 1199 users from 12/14/25-1/12/26. 1096 of those users were new.
43% of those users accessed this site with a desktop, 0% with a tablet, and 55% on mobile devices.
Top Posts/Pages
1. Voices of Nicotine Recovery
2. Meeting Calendar
3. Speaker Shares
4. Readings @ Meetings
5. Chairing @ Meetings
6. Events
7. Sponsorship
8. Resources
9. Contact Us
10. Group Conscience Meetings
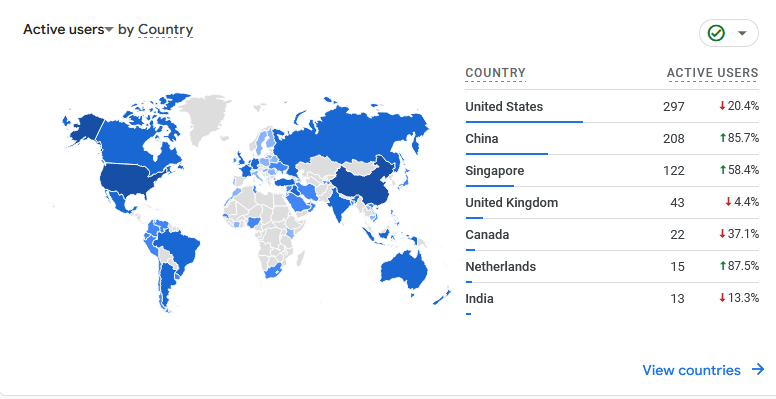
There were 1679 sessions by 781 users from 11/8/25-12/7/25. 618 of those users were new.
56% of those users accessed this site with a desktop, 2% with a tablet, and 42% on mobile devices.
Top Posts/Pages
1. Voices of Nicotine Recovery
2. Meeting Calendar
3. Speaker Shares
4. Readings @ Meetings
5. Events
6. Group Conscience Meetings
7. VONR FAQs
8. Chairing @ Meetings
9. Sponsorship
10. About
There were 1868 sessions by 735 users from 10/12/25-11/10/25. 618 of those users were new.
45% of those users accessed this site with a desktop, 2% with a tablet, and 53% on mobile devices.
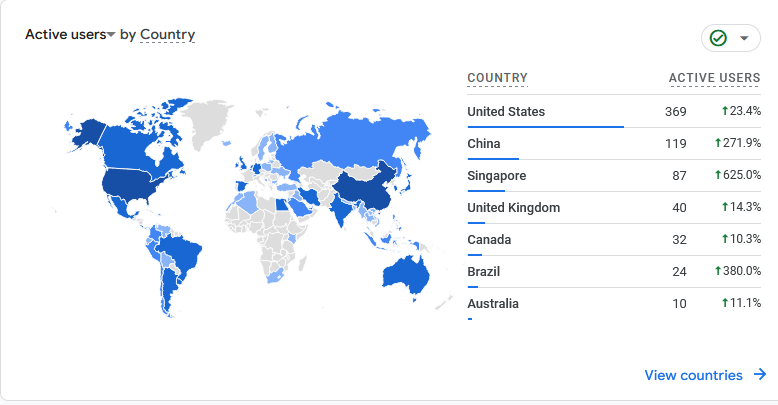
Top Posts/Pages
1. Meeting Calendar
2. Voices of Nicotine Recovery
3. Speaker Shares
4. Readings @ Meetings
5. Events
6. Chairing @ Meetings
7. Group Conscience Meetings
8. Contact Us
9. Resources
10. Sponsorship
There were 1502 sessions by 535 users from 9/15/25-10/14/25. 435 of those users were new.
44% of those users accessed this site with a desktop, 2% with a tablet, and 54% on mobile devices.
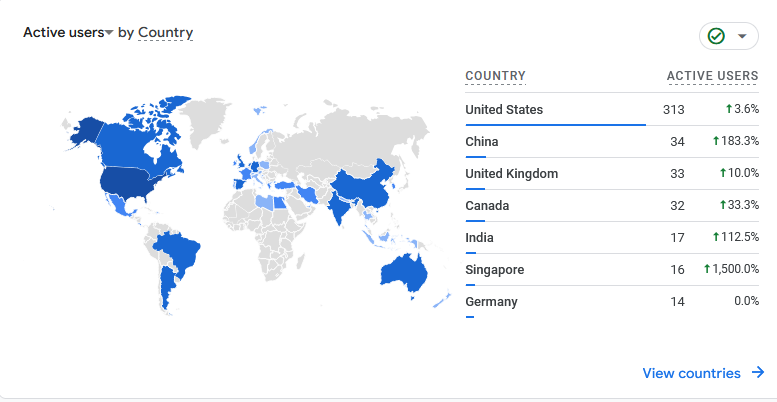
Top Posts/Pages
1. Meeting Calendar
2. Voices of Nicotine Recovery
3. Speaker Shares
4. Events
5. Readings @ Meetings
6. Chairing @ Meetings
7. Sponsorship
8. Resources
9. Contact Us
10. VONR FAQs
There were 1283 sessions by 533 users from 8/21/25-9/19/25. 425 of those users were new.
41% of those users accessed this site with a desktop, 4% with a tablet, and 55% on mobile devices.

Top Posts/Pages
1. Meeting Calendar
2. Voices of Nicotine Recovery
3. Speaker Shares
4. Readings @ Meetings
5. Chairing @ Meetings
6. Events
7. Resources
8. Contact Us
9. Group Conscience Meetings
There were 1357 sessions by 476 users from 7/21/25-8/19/25. 366 of those users were new.
37% of those users accessed this site with a desktop, 2% with a tablet, and 61% on mobile devices.
There were 1541 sessions by 591 users from 6/18/25-7/17/25. 496 of those users were new.
37% of those users accessed this site with a desktop, 2% with a tablet, and 61% on mobile devices.
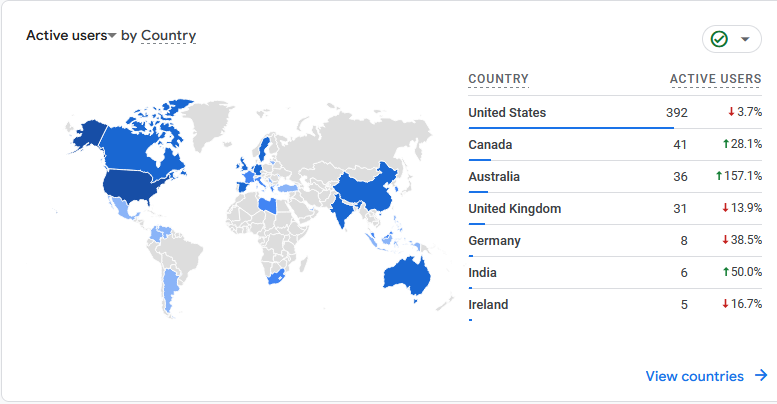
Top Posts/Pages
1. Meeting Calendar
2. Voices of Nicotine Recovery
3. Speaker Shares
4. Readings @ Meetings
5. Events
6. Resources
7. Chairing Meetings
8. Group Conscience Meetings
9. Protected NicA Conference Recordings
10. Contact Us
There were 1501 sessions by 593 users from 5/22/25-6/20/25. 482 of those users were new.
37% of those users accessed this site with a desktop, 2% with a tablet, and 61% on mobile devices.

Top Posts/Pages
1. Meeting Calendar
2. Voices of Nicotine Recovery
3. Speaker Shares
4. Readings @ Meetings
5. Chairing Meetings
6. Events
7. Protected NicA Conference Recordings
8. Sponsorship
9. Group Conscience Meetings
10. Resources
There were 1389 sessions by 817 users from 4/20/25-5/19/25. 474 of those users were new.
41% of those users accessed this site with a desktop, 2% with a tablet, and 57% on mobile devices.

Top Posts/Pages
1. Meeting Calendar
2. Voices of Nicotine Recovery
3. Speaker Shares
4. Readings @ Meetings
5. Chairing Meetings
6. Protected NicA Conference Recordings
7. Events
8. Resources
9. Group Conscience Meetings
There were 1398 sessions by 571 users from 3/19/25-4/17/25. 474 of those users were new.
36% of those users accessed this site with a desktop, 3% with a tablet, and 61% on mobile devices.
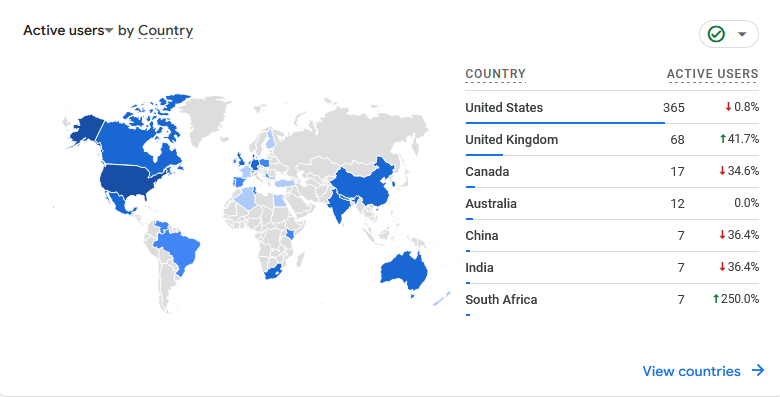
Top Posts/Pages
1. Meeting Calendar
2. Voices of Nicotine Recovery
3. Speaker Shares
4. Readings @ Meetings
5. Events
6. Group Conscience Meetings
7. Chairing Meetings
8. Resources
9. Contact Us
10. Type Shares
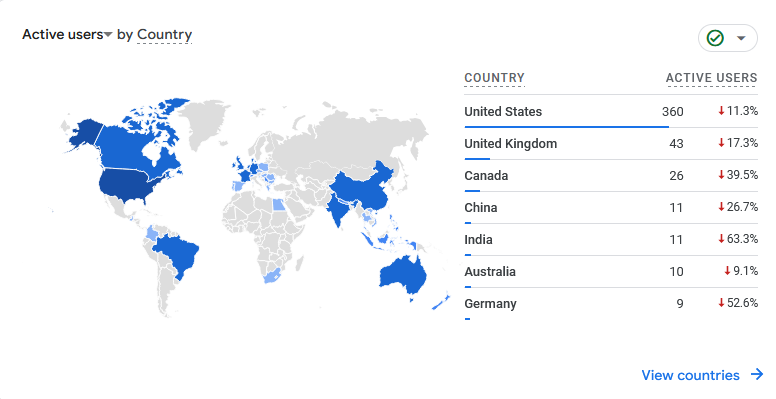
There were 1332 sessions by 553 users from 2/17/25-3/18/25. 45 of those users were new.
42% of those users accessed this site with a desktop, 3% with a tablet, and 55% on mobile devices.
Top Posts/Pages
1. Meeting Calendar
2. Voices of Nicotine Recovery
3. Speaker Shares
4. Readings @ Meetings
5. Chairing Meetings
6. Events
7. Group Conscience Meetings
8. Resources
9. Training
10. Contact Us
There were 1360 sessions by 701 users from 12/19/25-2/17/25. 598 of those users were new.
39% of those users accessed this site with a desktop, 3% with a tablet, and 58% on mobile devices.

Top Posts/Pages
1. Meeting Calendar
2. Voices of Nicotine Recovery
3. Speaker Shares
4. Readings @ Meetings
5. Events
6. Chairing Meetings
7. Resources
8. Group Conscience Meetings
9. Training
10. Contact Us
There were 1266 sessions by 496 users from 12/21/24-1/19/25. 393 of those users were new.
40% of those users accessed this site with a desktop, 4% with a tablet, and 56% on mobile devices.

Top Posts/Pages
1. Meeting Calendar
2. Voices of Nicotine Recovery
3. Speaker Shares
4. Readings @ Meetings
5. Events
6. Chairing Meetings
7. Sponsorship
8. Resources
9. Voices of Nicotine Recovery FAQs
10. Group Conscience Meetings
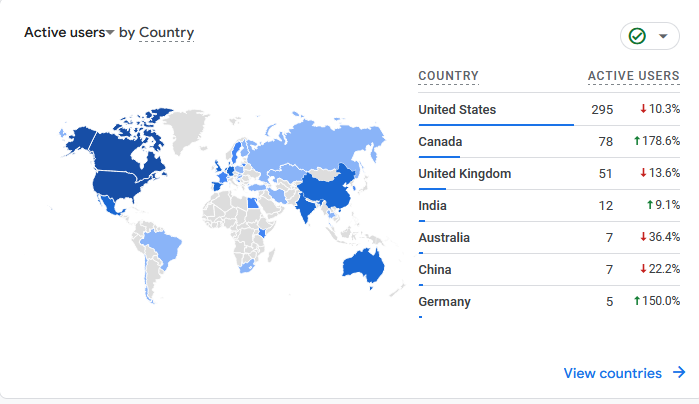
1386 sessions by 518 users from 11/19/24-12/18/24. 387 of those users were new.
44% of those users accessed this site with a desktop, 3% with a tablet, and 53% on mobile devices.
Top Posts/Pages
1. Meeting Calendar
2. Voices of Nicotine Recovery
3. Speaker Shares
4. Readings @ Meetings
5. Chairing Meetings
6. Events
7. Group Conscience Meetings
8. Resources
9. Contact Us
10. About
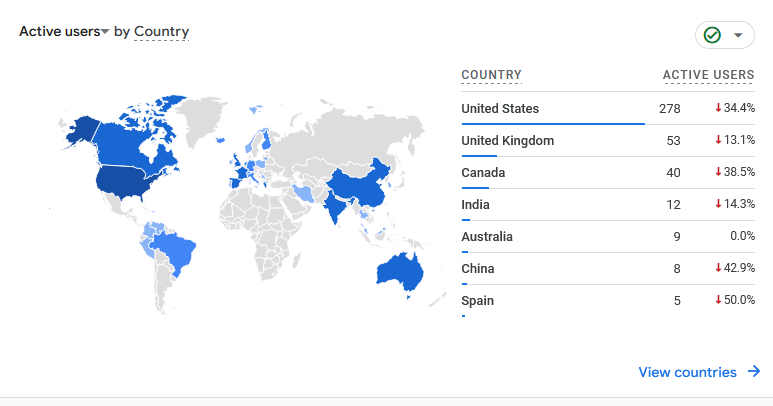
1404 session by 472 users from 10/25/24-11/23/24. 387 of those users were new.
41% of those users accessed this site with a desktop, 3% with a tablet, and 56% on mobile devices.
Top Posts/Pages
1.Meeting Calendar – Voices of Nicotine Recovery
3.Speaker Shares – Voices of Nicotine Recovery
4.Readings @ Meetings – Voices of Nicotine Recovery
5.Events – Voices of Nicotine Recovery
6.Chairing Meetings – Voices of Nicotine Recovery
7.Resources – Voices of Nicotine Recovery
8.Sponsorship – Voices of Nicotine Recovery
9.Type Shares – Voices of Nicotine Recovery
10.Contact Us – Voices of Nicotine Recovery
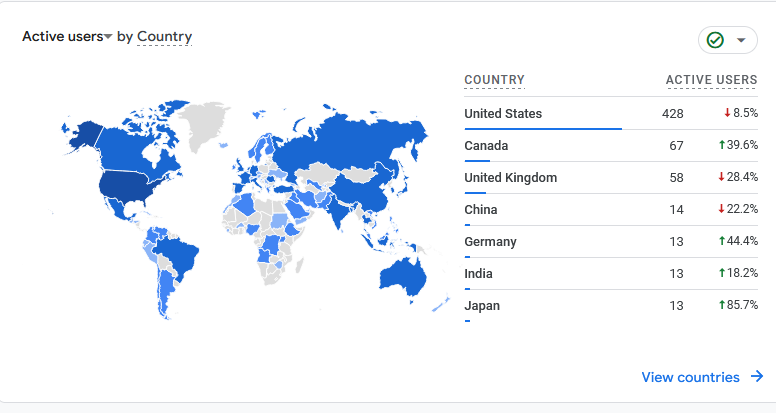
1711 sessions by 829 users from 9/24/24-10/23/24. 727 of those users were new.
42% of those users accessed this site with a desktop, 3% with a tablet, and 55% on mobile devices.
Top Posts/Pages
1. Meeting Calendar
2. Voices of Nicotine Recovery
3. Speaker Shares
4. Events
5. Readings @ Meetings
6. Chairing Meetings
7. Resources
8. Sponsorship
9. Contact Us
1714 sessions by 796 users from 8/28/24-9/26/24
42% of those users accessed this site with a desktop, 3% with a tablet, and 55% on mobile devices.
Top Posts/Pages
1. Meeting Calendar
2. Voices of Nicotine Recovery
3. Speaker Shares
4. Readings @ Meetings
5. Events
6. Chairing Meetings
7. Group Conscience Meetings
8. Sponsorship
9. Resources
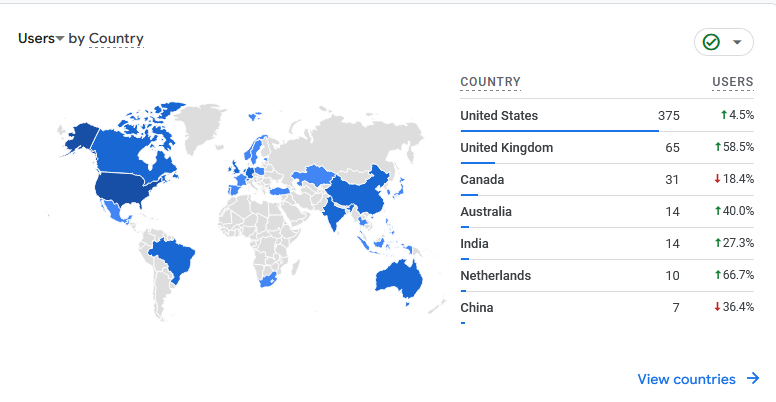
1457 sessions by 581 users from 7/25/24-8/23/24
40% of those users accessed this site with a desktop, 5% with a tablet, and 55% on mobile devices.
1,399 sessions from 6/27/24-7/26/24.
661 users with 50% access on mobile devices, 47% access with desktop computer, 1% with tablet.

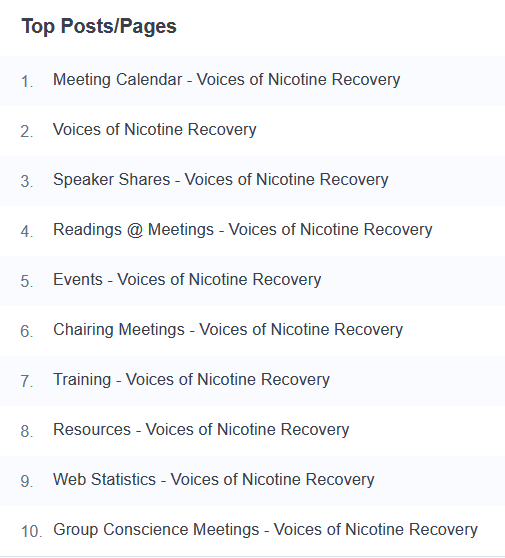
Top Posts/Pages
1. Meeting Calendar
2.Voices of Nicotine Recovery
3. Speaker Shares
4. Readings @ Meetings
5. Events
6. Chairing Meetings
7.Resources
8.Group Conscience Meetings
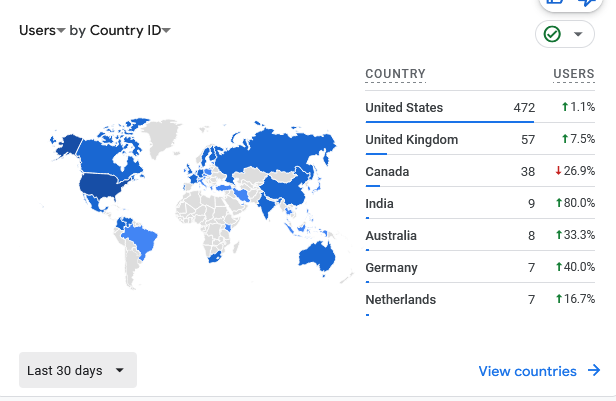
1,773 sessions from 4/18/24-5/17/24.
Average of 59 sessions per day with 661 users; 56% access on mobile devices, 42% access with desktop computer, 2% with tablet.
2,047 sessions from 1/23/24 – 2/21/24. Average 68 sessions per day, users from 51 countries; 37% access on mobile devices, 60% access with desktop computer, 3% access with tablet.
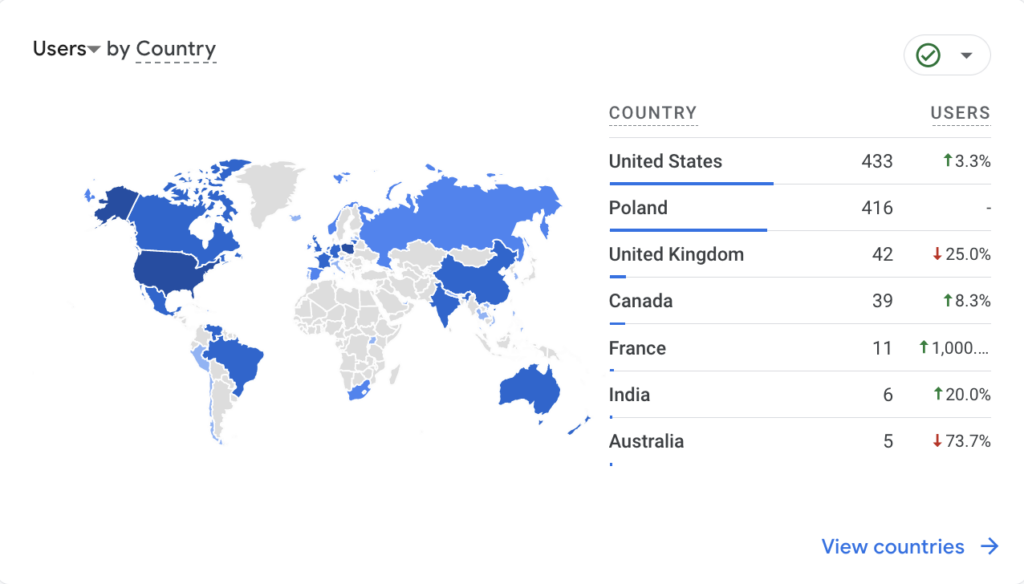
1,500 sessions from 11/17/2023 – 12/16/2023. Average 50 sessions per day, users from 49 countries, speaking 17 languages; 56% access on mobile devices, 42% access with desktop computer, 2% access with tablet.
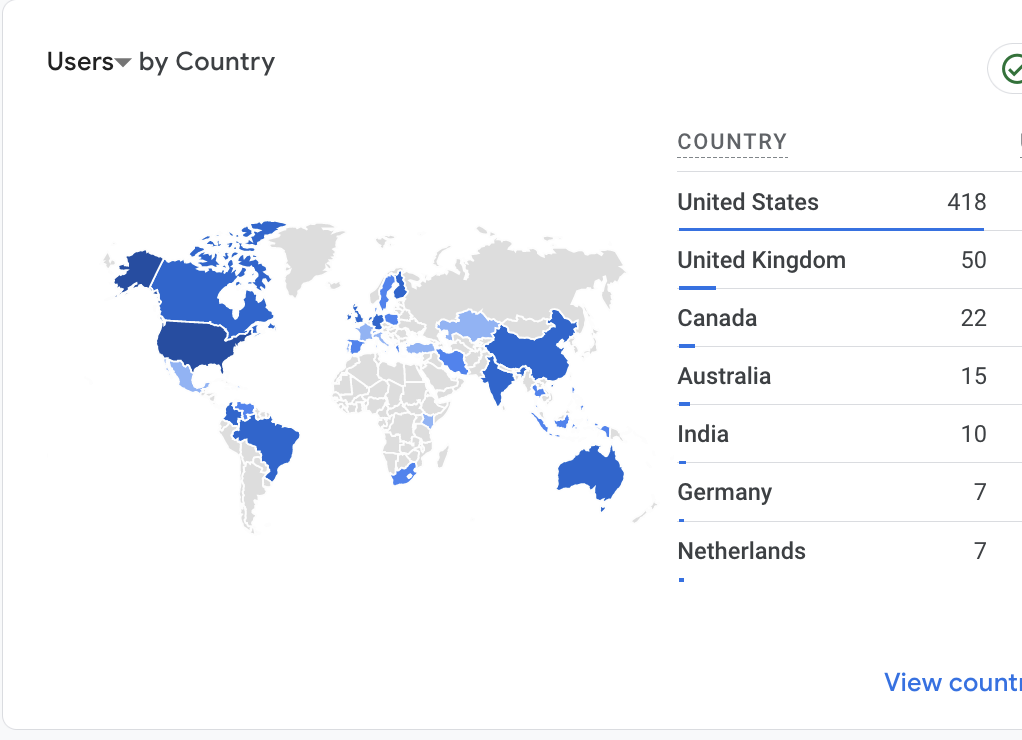
1,423 sessions from 5/1/2023 – 5/31/2023. Average 46 sessions per day, users from 33 countries, speaking 31 languages; 57% access on mobile devices, 40% access with desktop computer, 3% access with tablet.

1608 sessions from 3/1/2023 – 3/31/2023. Average 52 sessions per day, users from 34 countries, speaking 22 languages; 55% access on mobile devices, 40% access with desktop computer, 5% access with tablet.

1678 sessions from 1/1/2023 – 1/31/2023. Average 54 sessions per day, users from 39 countries, speaking 29 languages; 60% access on mobile devices, 37% access with desktop computer, 3% access with tablet.
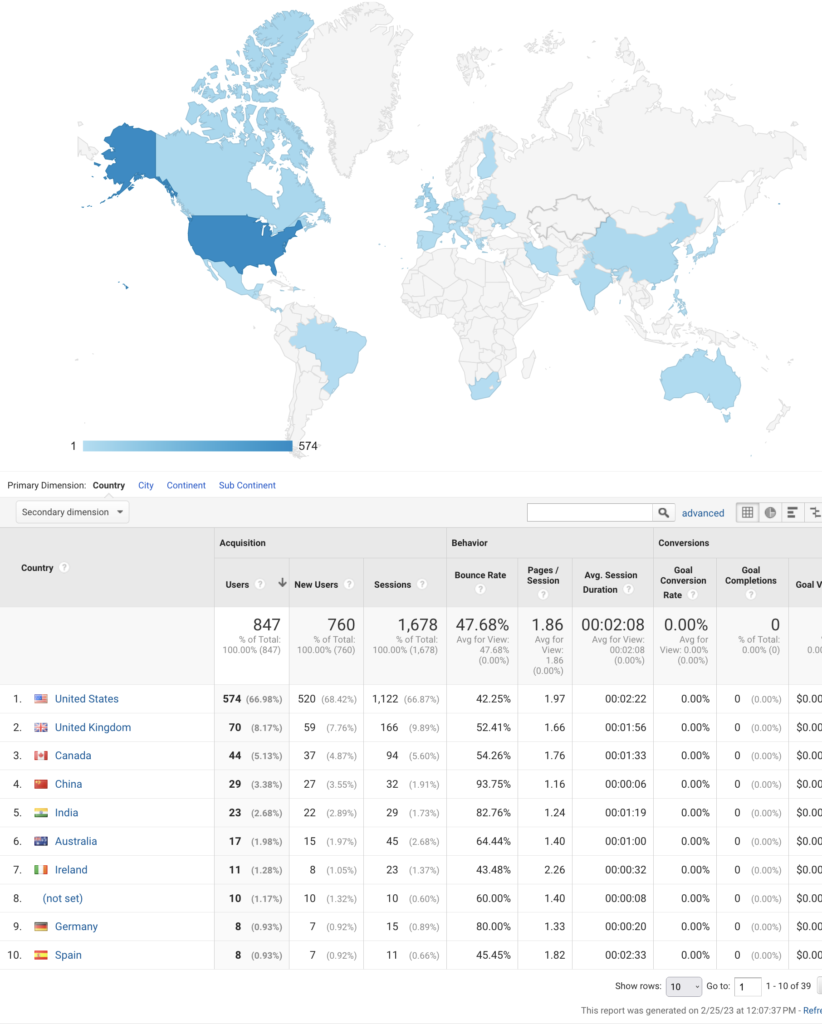
2,150 sessions from 6/1/2022 – 6/30/2022. Average 72 sessions per day, users from 108 countries, speaking 64 languages; 52% access on mobile devices, 44% access with desktop computer, 4% access with tablet.

1,708 sessions from 2/1/2022 – 2/28/2022. Average about 61 sessions per day, users from 32 countries, speaking 25 languages; 51% access on mobile devices, 46% access with desktop computer, 3% access with tablet.

1,630 sessions from 12/1/2021 – 12/31/2021. Average about 53 sessions per day, users from 37 countries, speaking 33 languages; 55% access on mobile devices (up), 41% access with desktop computer (down), 4% access with tablet (up).

1,689 sessions from 11/1/2021 – 11/30/2021. Average about 56 sessions per day, users from 37 countries, speaking 29 languages; 52% access on mobile devices (up), 43% access with desktop computer (down), 5% access with tablet (up).

2,078 sessions from 10/1/2021 – 10/31/2021. Average about 67 sessions per day, users from 38 countries, speaking 25 languages; 51% access on mobile devices, 45% access with desktop computer, 4% access with tablet.
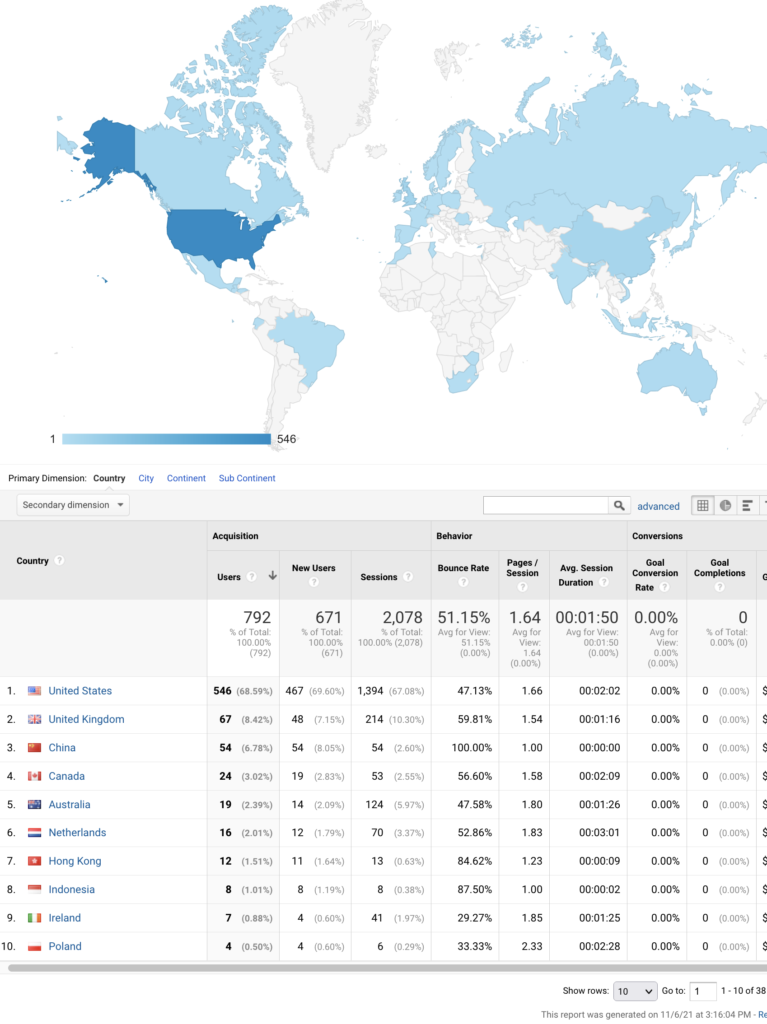
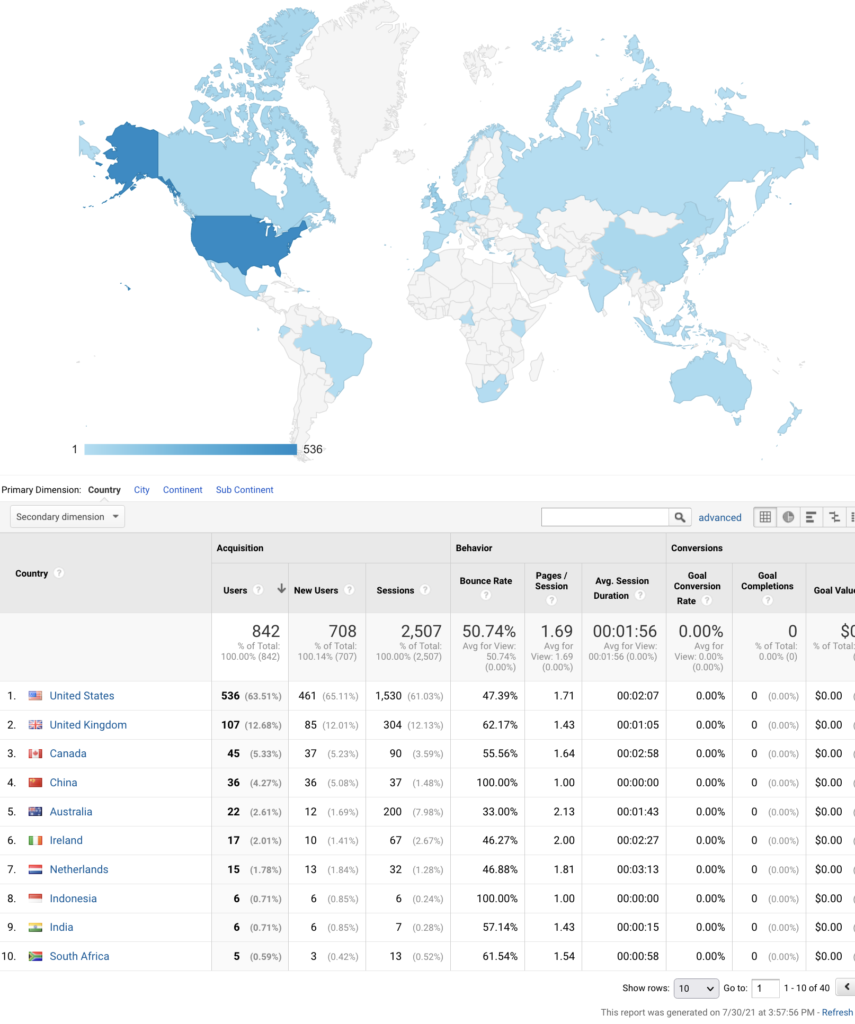
2,507 sessions from 7/1/2021 – 7/30/2021. Average about 84 sessions per day, users from 40 countries, speaking 38 languages; 53% access on mobile devices, 39% access with desktop computer, 8% access with tablet.
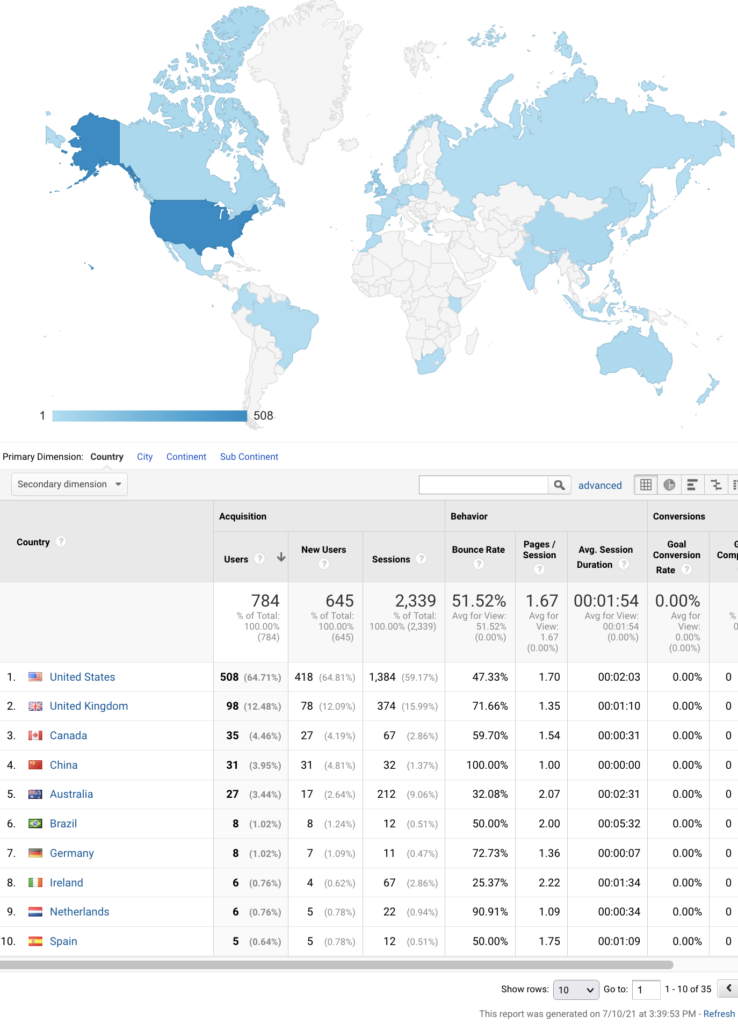
2,339 sessions from 6/1/2021 – 6/30/2021. Average about 78 sessions per day, users from 36 countries, speaking 35 languages; 52% access on mobile devices, 39% access with desktop computer, 8% access with tablet.
2,878 sessions from 3/1/2021 – 3/31/2021. Average about 93 sessions per day, users from 46 countries, speaking 37 languages; 57% access on mobile devices, 39% access with desktop computer, 4% access with tablet.

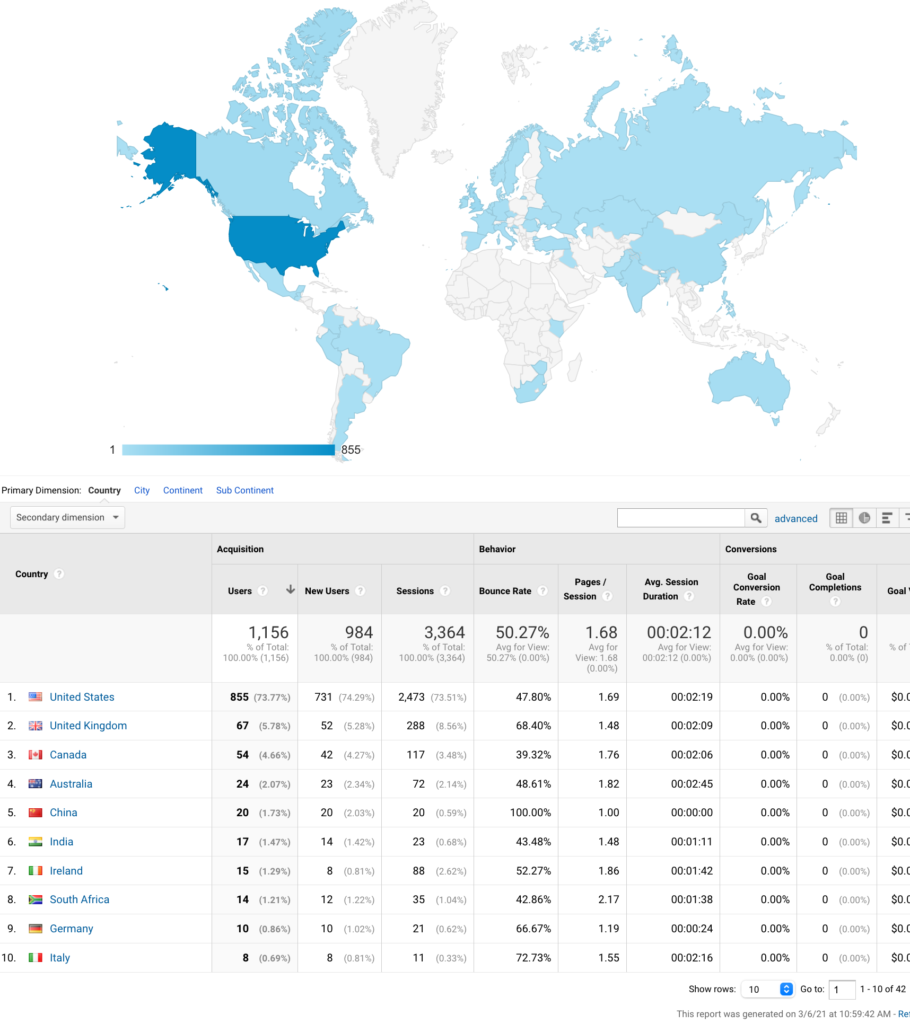
3,364 sessions from 2/1/2021 – 2/28/2021. Average about 120 sessions per day, users from 42 countries, speaking 33 languages; 53% access on mobile devices, 43% access with desktop computer, 4% access with tablet.
3,465 sessions from 1/1/2021 – 1/31/2021. Average about 112 sessions per day, users from 52 countries, speaking 39 languages; 55% access on mobile devices, 40% access with desktop computer, 5% access with tablet.

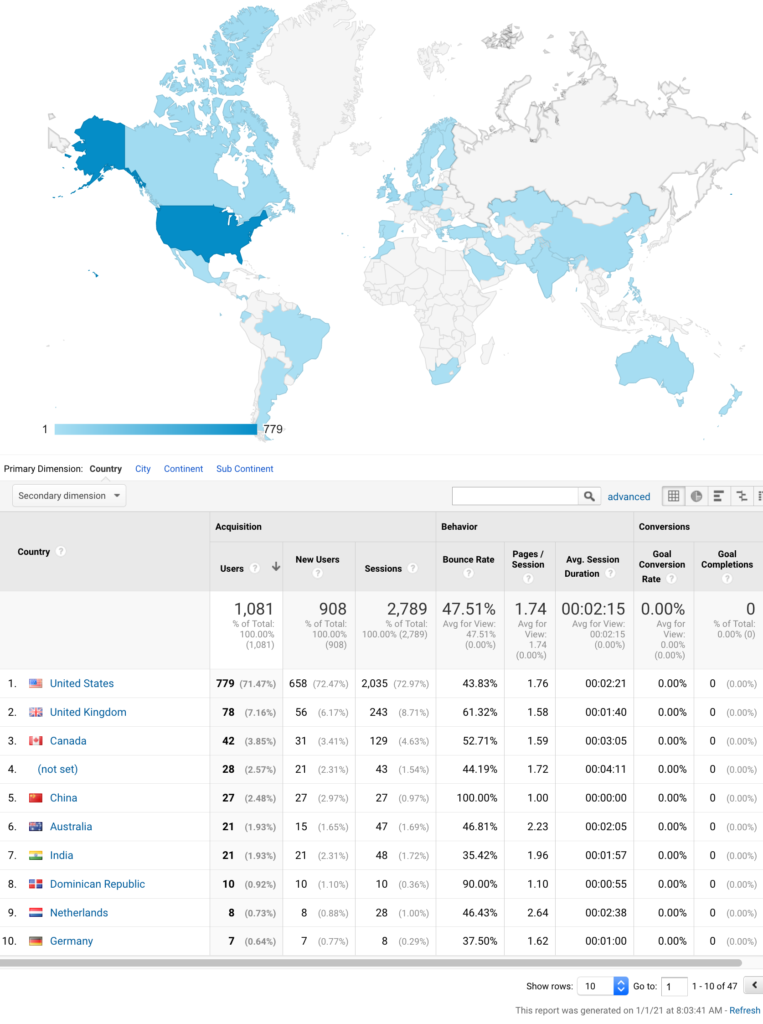
2,789 sessions from 12/1/2020 – 12/31/2020. Average about 90 sessions per day, users from 47 countries, speaking 32 languages; 48% access on mobile devices, 47% access with desktop computer, 5% access with tablet.
3,047 sessions from 11/1/2020 – 11/30/2020. Average about 126 sessions per day, from 46 countries, speaking 29 languages. 55% access on mobile devices, 41% access with desktop computer, 4% access with tablet.

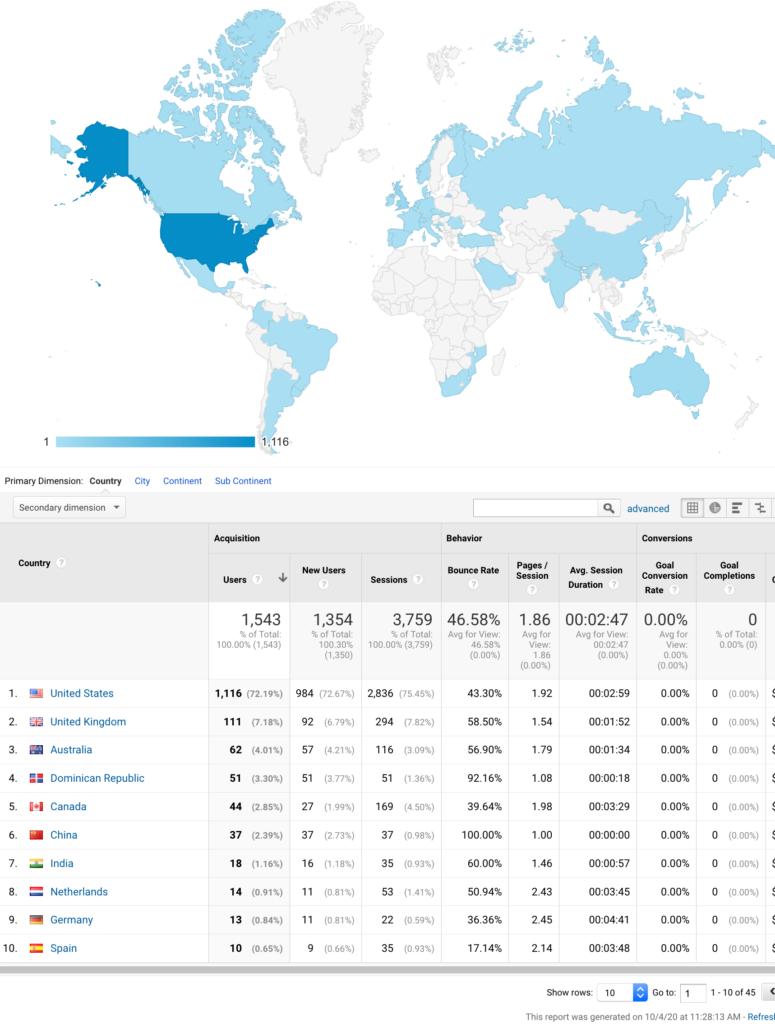
3,759 sessions from 9/4/2020 – 10/3/2020. Average about 125 sessions per day, from 45 countries, speaking 33 languages. 53% access on mobile devices, 42% access with desktop computer, 5% access with tablet.
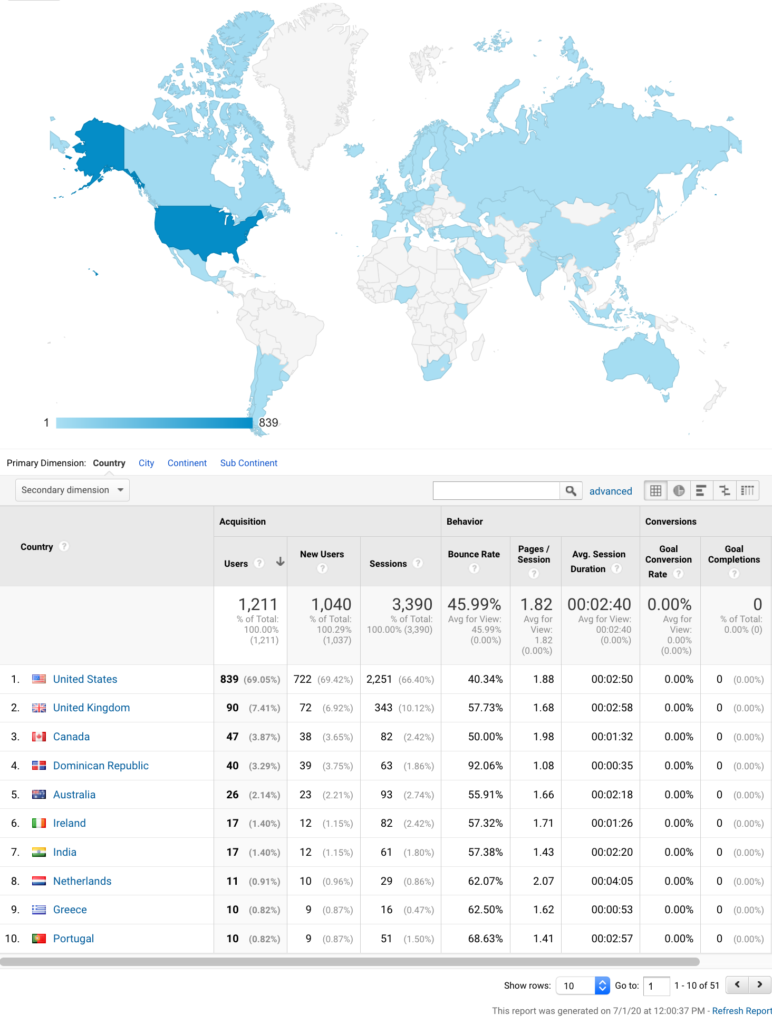
3,390 sessions from 6/1/2020 – 6/30/2020. Average about 113 sessions per day, from 51 countries, speaking 39 languages. 54% access on mobile devices, 41% access with desktop computer, 5% access with tablet.
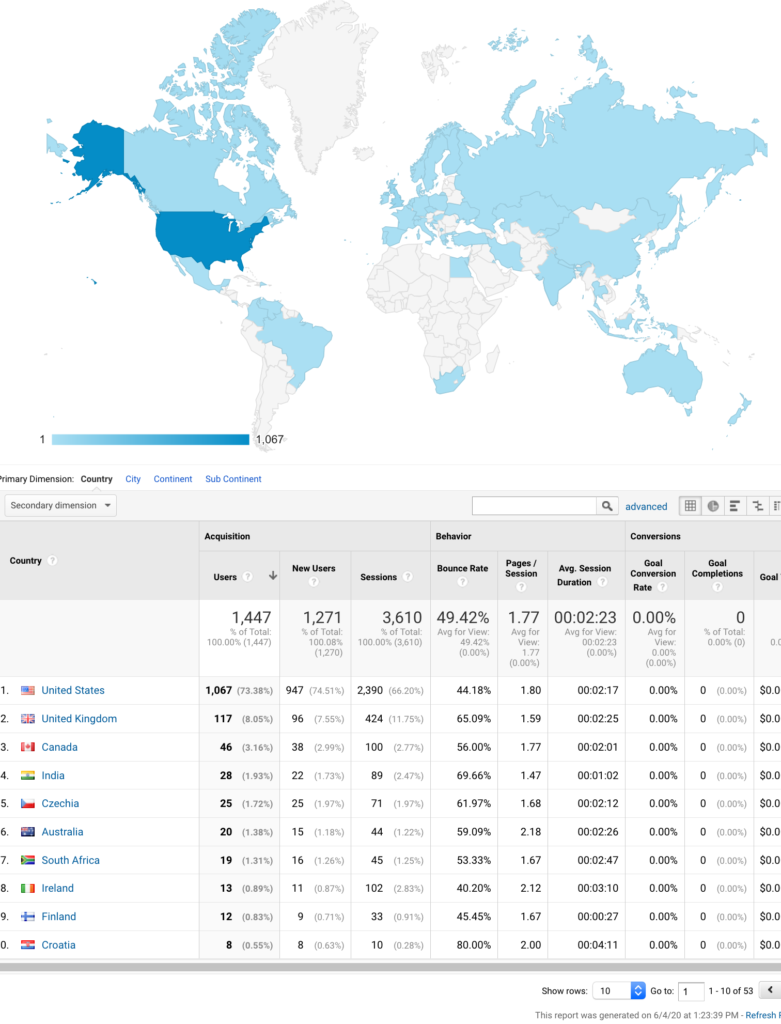
3,610 sessions from 5/1/2020 – 5/31/2020. Average about 116 sessions per day, from 53 countries, speaking 34 languages. 54% access on mobile devices, 41% access with desktop computer, 5% access with tablet.
3,618 sessions from 4/1/2020 – 4/30/2020. Average about 120 sessions per day, from 58 countries, speaking 39 languages. 53% access on mobile device (now accessed more from mobile devices than computers), 42% access with desktop computer, 4% access with tablet.
2,861 sessions from 2/1/2020 – 3/1/2020. Average about 95 sessions per day, from 42 countries, speaking 25 languages. 43% access on desktop computer, 50% access with mobile (significant increase), device (iPhone, Android), 6% access with tablet.
2,265 sessions from June 13 to July 14, 2018. Average about 73 sessions per day, from 49 countries, speaking 32 languages. 53% access on desktop computer, 39% access with mobile device (iPhone, Android), 8% access with tablet.
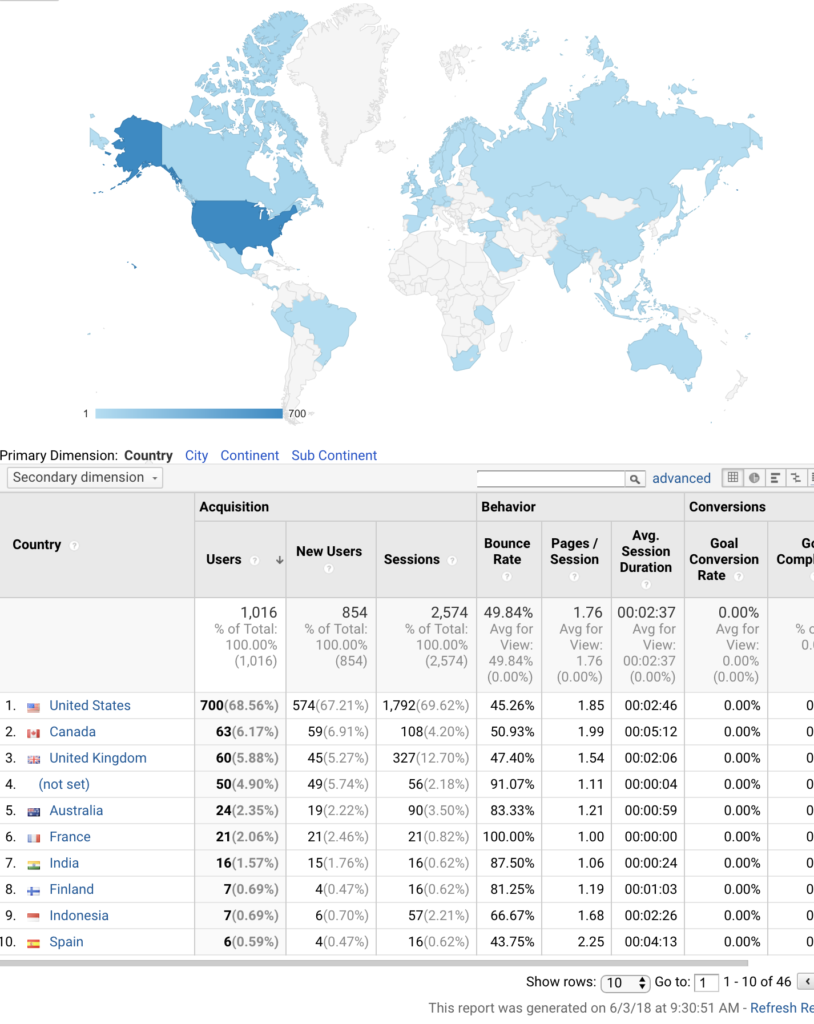
2,574 sessions from May 4, to June 3, 2018. Average about 83 sessions per day, from 46 countries, speaking 28 languages. 55% access on desktop computer, 37% access with mobile device (iPhone, Android), 6% access with tablet.
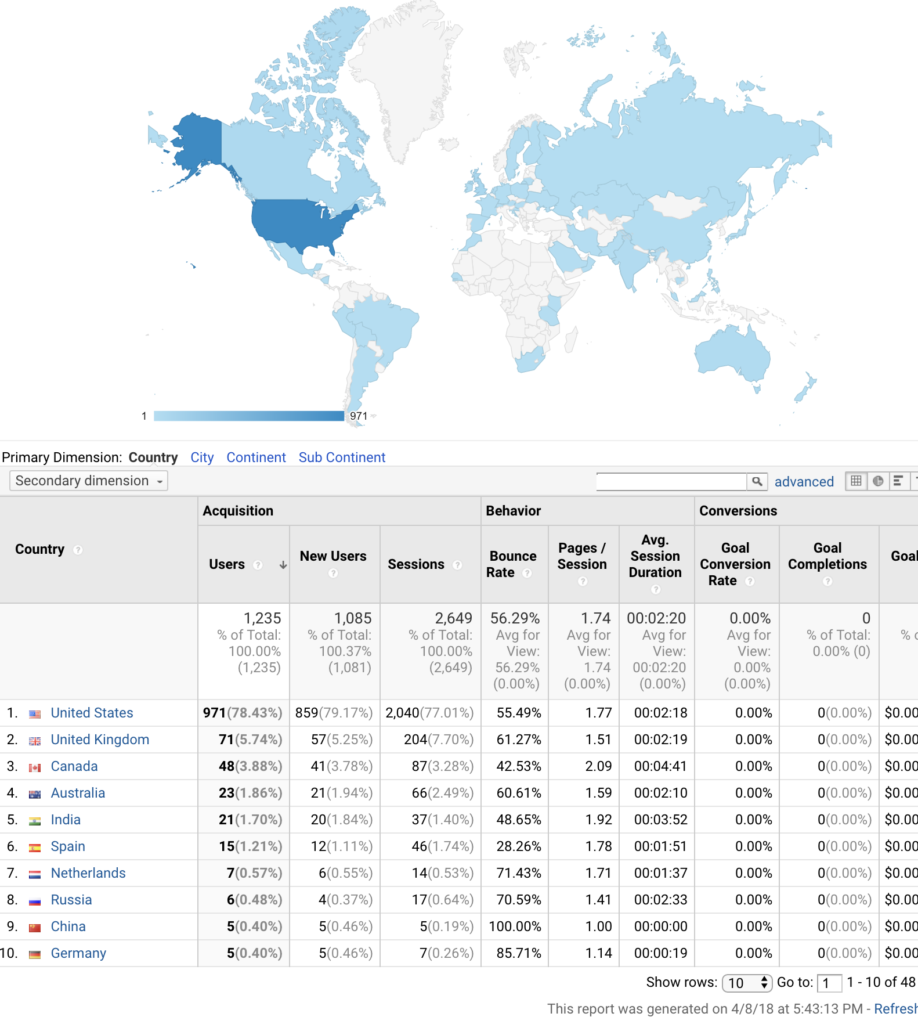
2,649 sessions from March 8, to April 7, 2018. Average about 85 sessions per day, from 48 countries, speaking 29 languages. 74% were new visits. 55% access on desktop computer, 35% access with mobile device (iPhone, Android), 10% access with tablet.
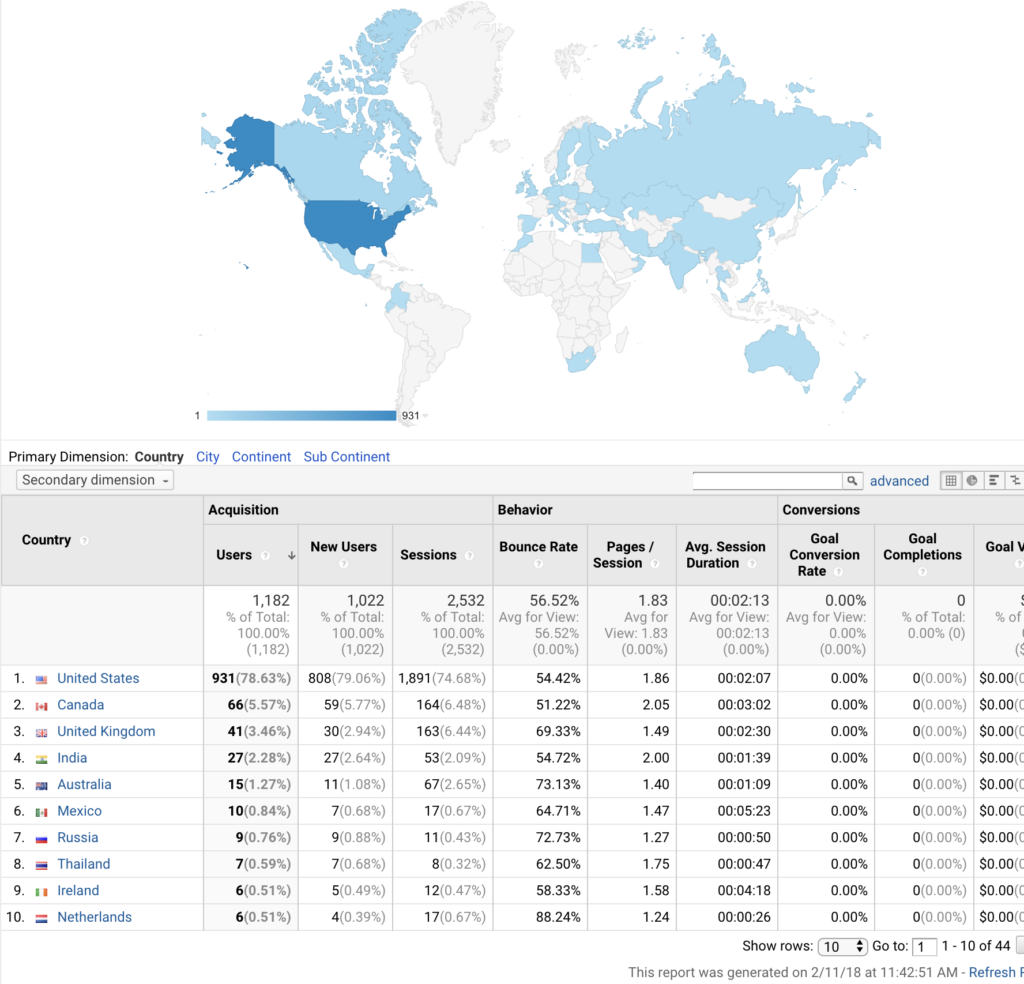
2,532 visits from January 11, to February 10, 2018. Average about 90 visits per day, from 44 countries, speaking 33 languages. 74% were new visits. 52% access on desktop computer, 40% access with mobile device (iPhone, Android), 8% access with tablet.
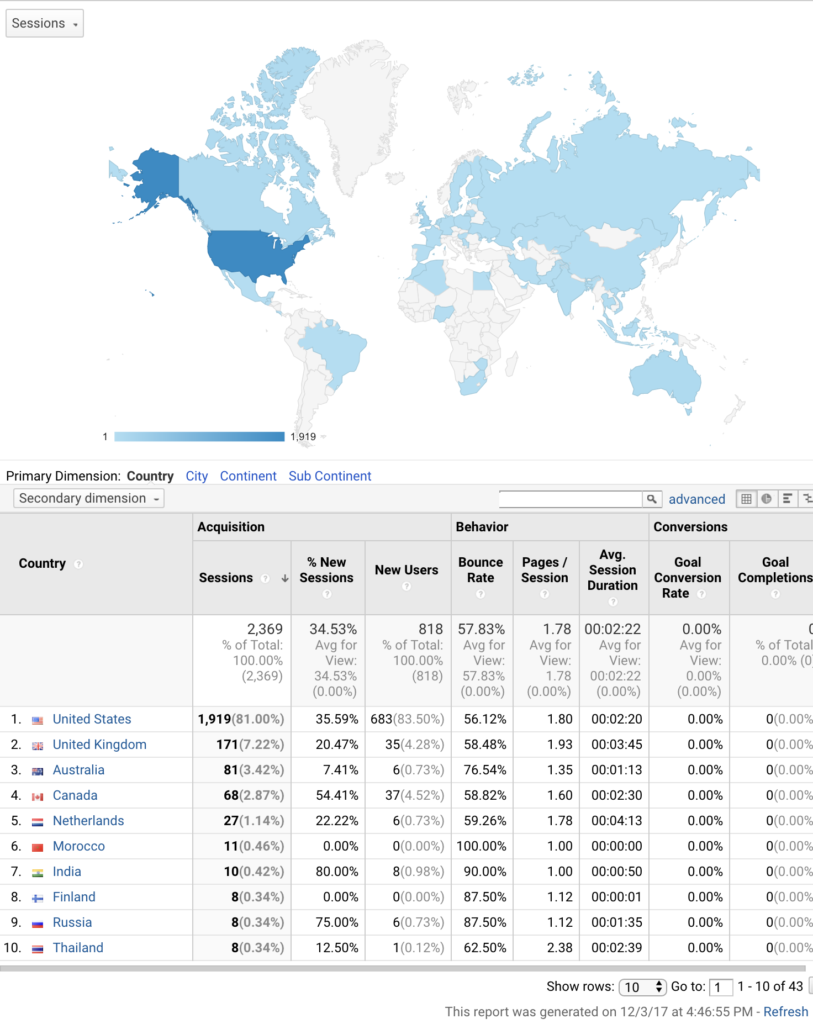
2,369 visits from November 3, to December 2, 2017. Average about 79 visits per day, from 43 countries, speaking 18 languages. 34% were new visits. 53% access on desktop computer, 40% access with mobile device (iPhone, Android), 7% access with tablet.
2,395 visits from October 5 to November 4, 2017. Average about 77 visits per day, from 42 countries, speaking 24 languages. 34% were new visits. 55% access on desktop computer, 37% access with mobile device (iPhone, Android), 8% access with tablet.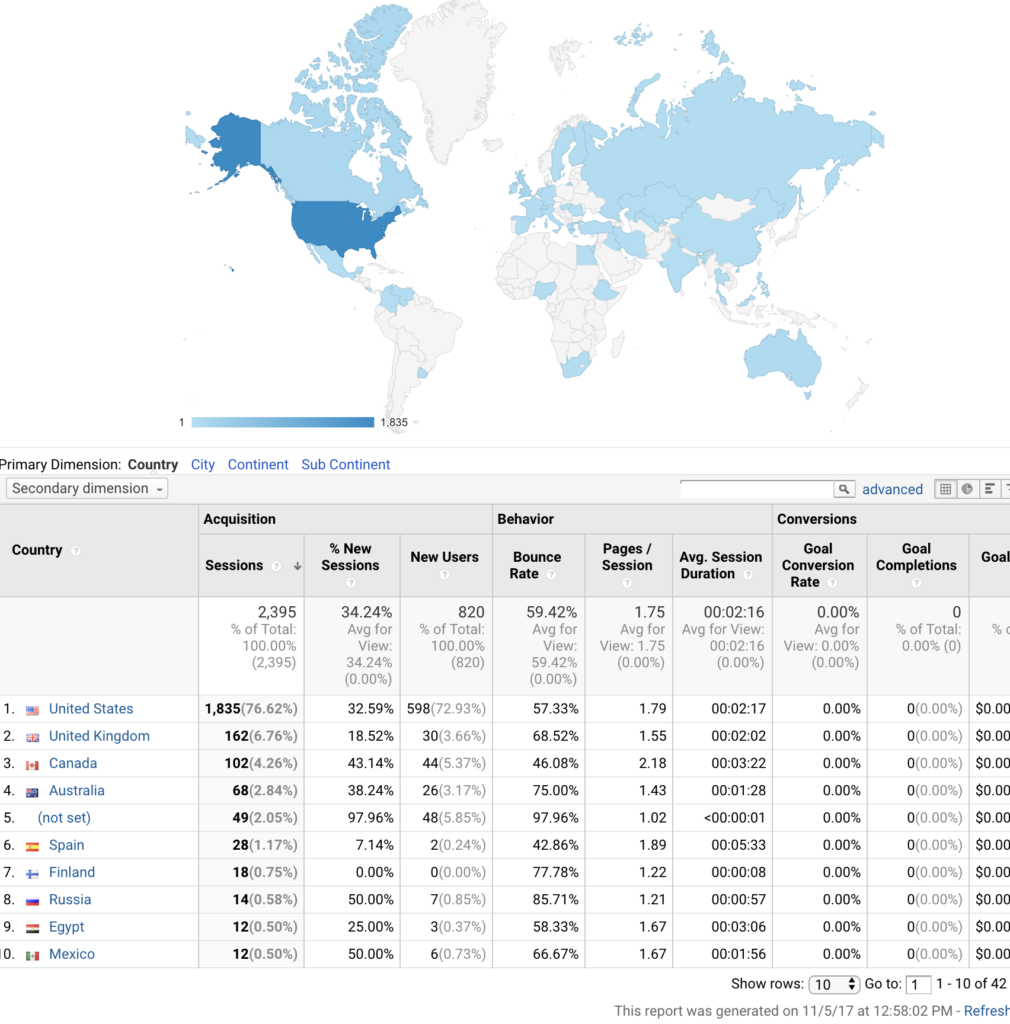
2,277 visits from Aug 30 to Sept 28, 2017. Average about 76 visits per day, from 40 countries, speaking 28 languages. 30% were new visits. 51% access on desktop computer, 38% access with mobile device (iPhone, Android), 10% access with tablet.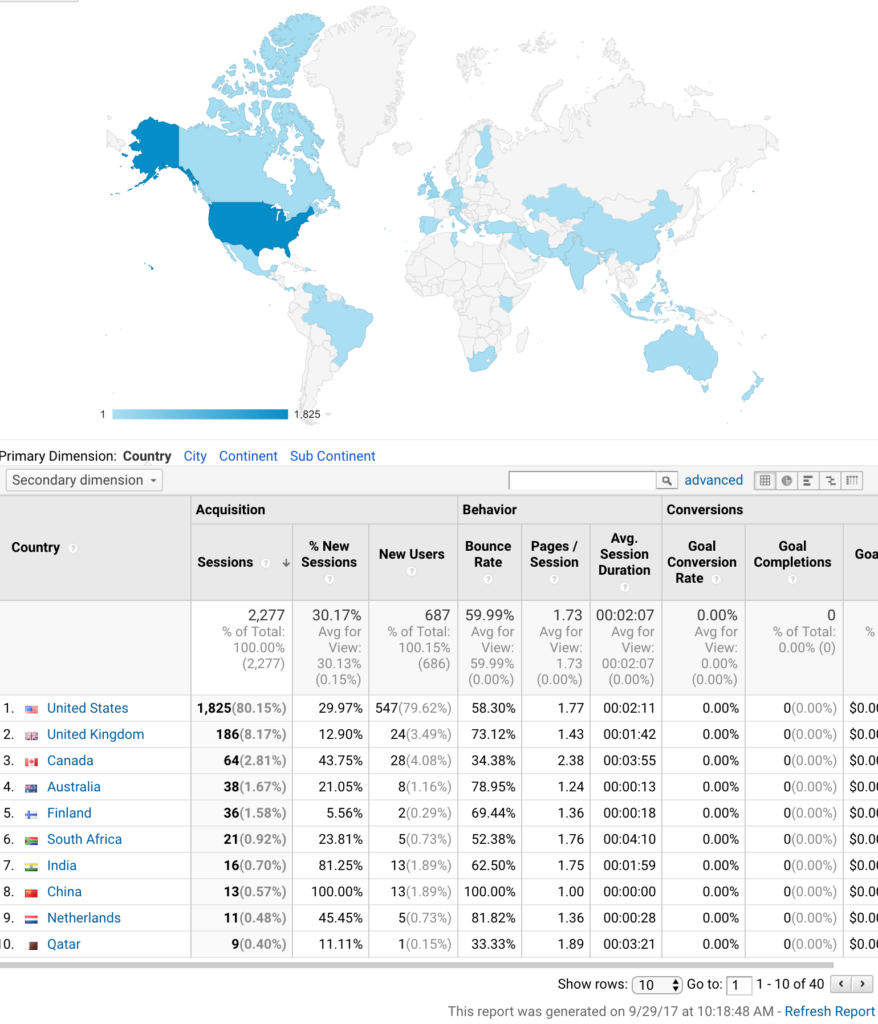
2,294 visits from August 9 to September 10, 2017. Average about 74 visits per day, from 36 countries, speaking 24 languages. 27.2% were new visits. 51% access on desktop computer, 35% access with mobile device (iPhone, Android), 13% access with tablet.
2,046 visits from July 1 to July 31, 2017. Average about 66 visits per day, from 41 countries, speaking 24 languages. 31.9% were new visits. 52% access on desktop computer, 38% access with mobile device (iPhone, Android), 9% access with tablet.
[no image]
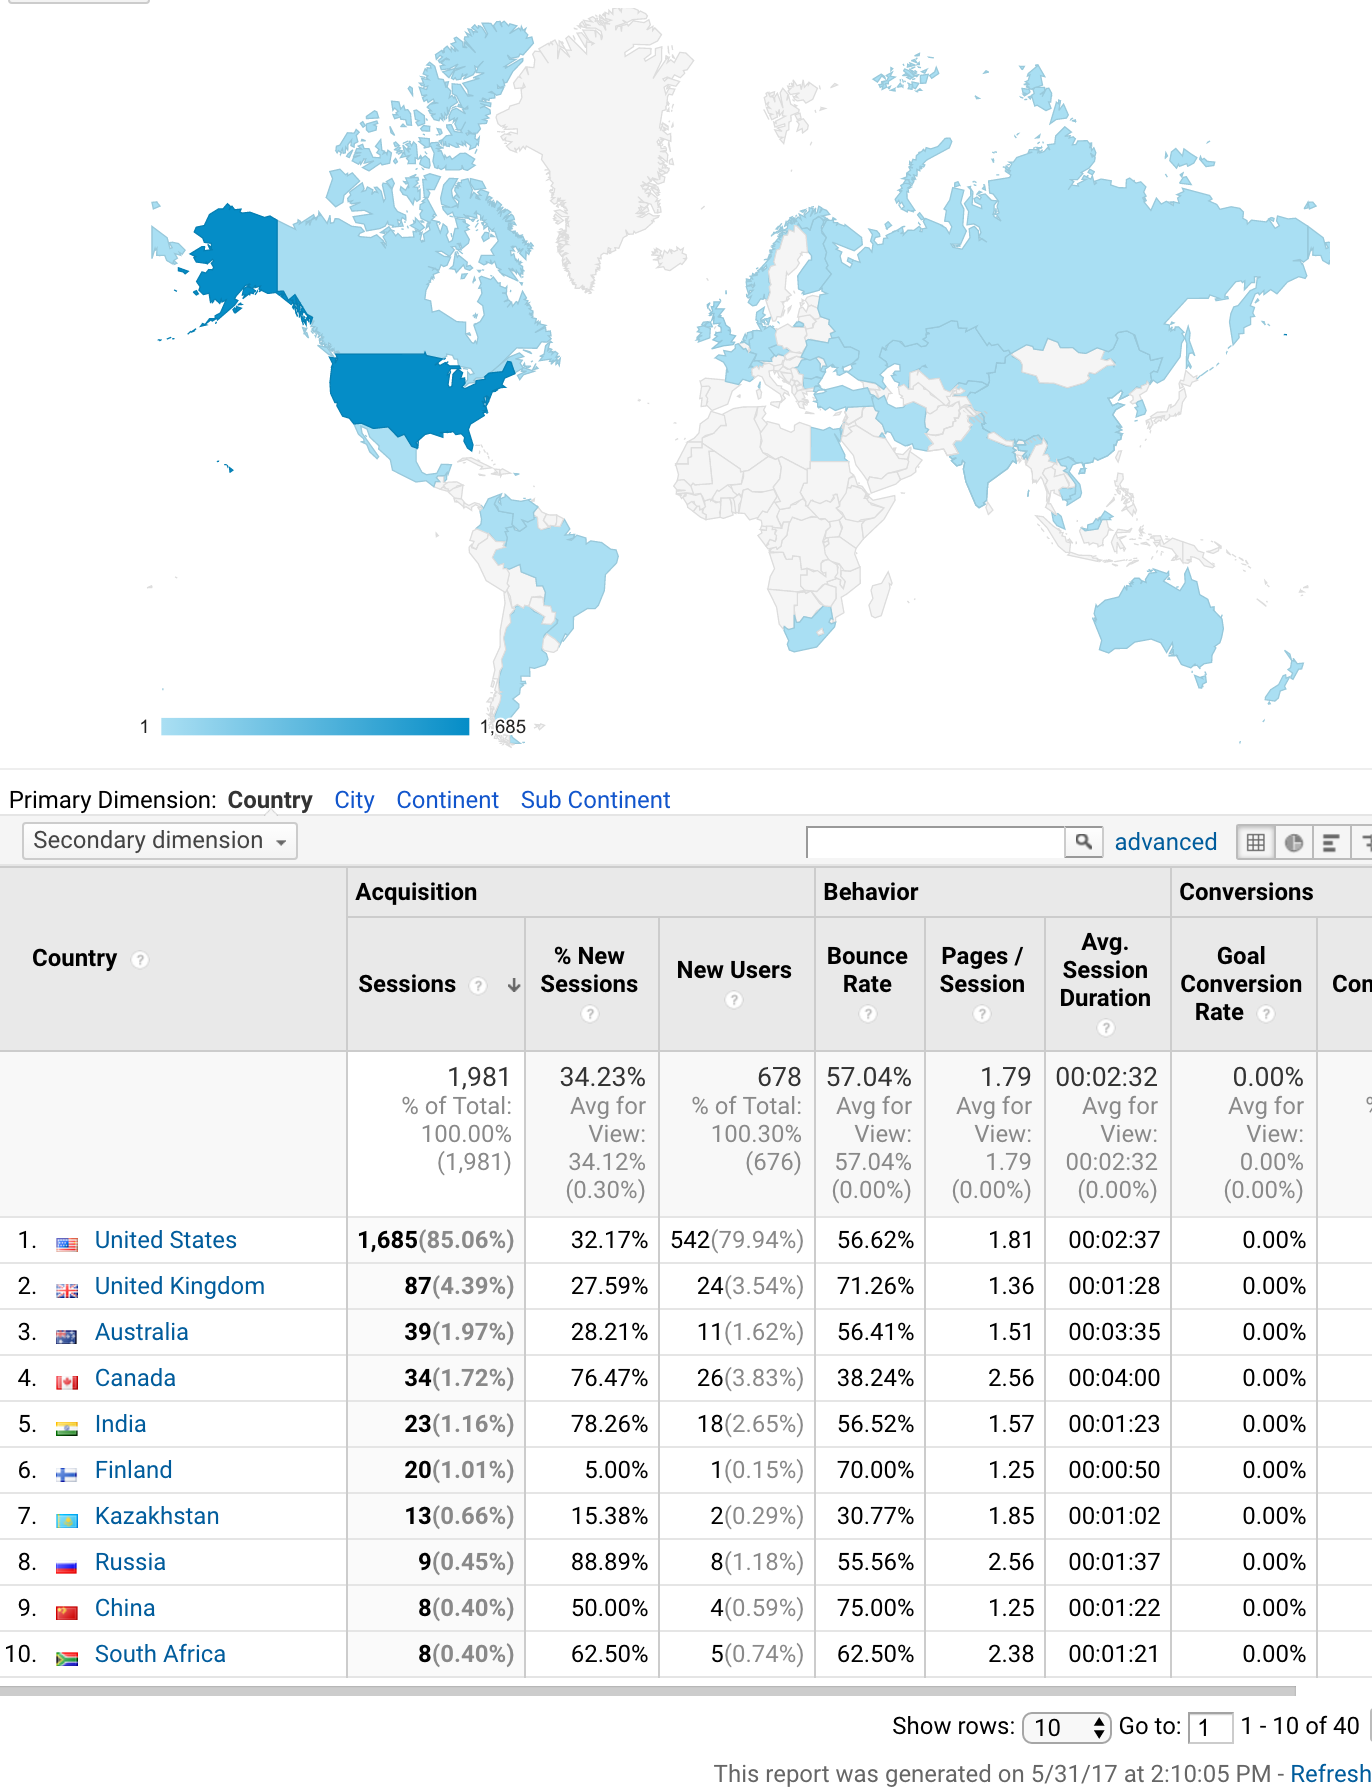
1,981 visits from April 30 to May 30, 2017. Average about 64 visits per day, from 40 countries, speaking 25 languages. 34% were new visits. 55% access on desktop computer, 39% access with mobile device (iPhone, Android), 6% access with tablet.
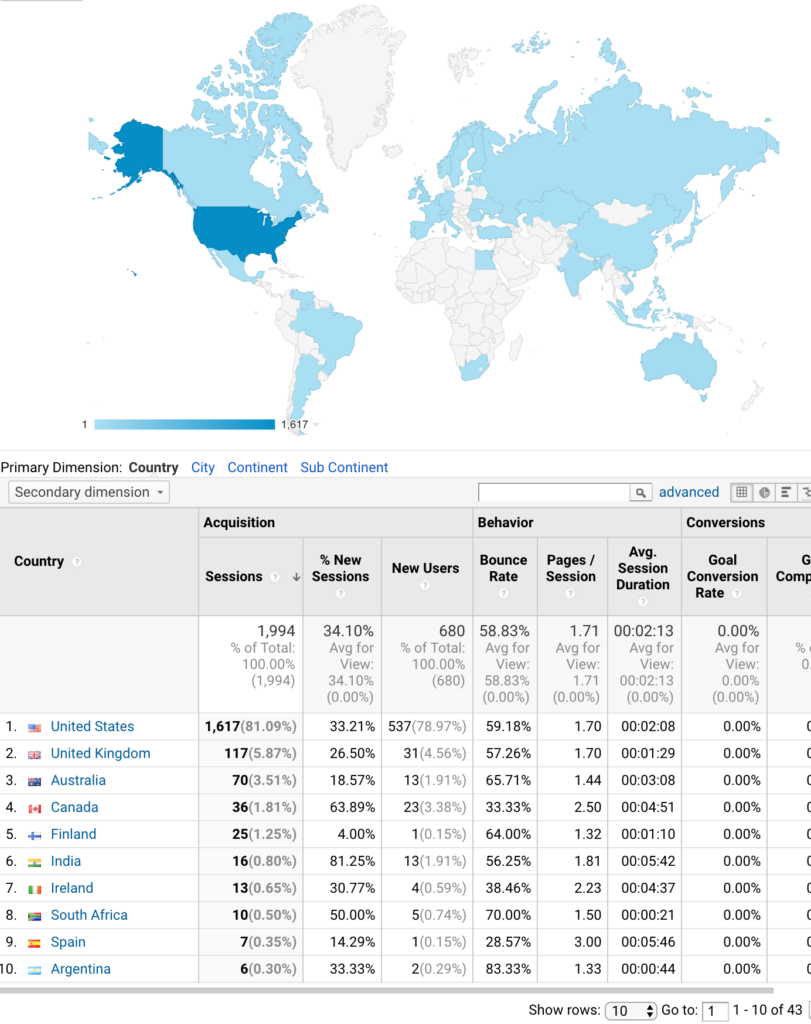
1,994 from April 7 to May 6, 2017. Average about 66 visits per day, from 43 countries, speaking 23 languages. 34% were new visits. 55% access on desktop computer, 40% access with mobile device (iPhone, Android), 5% access with tablet.
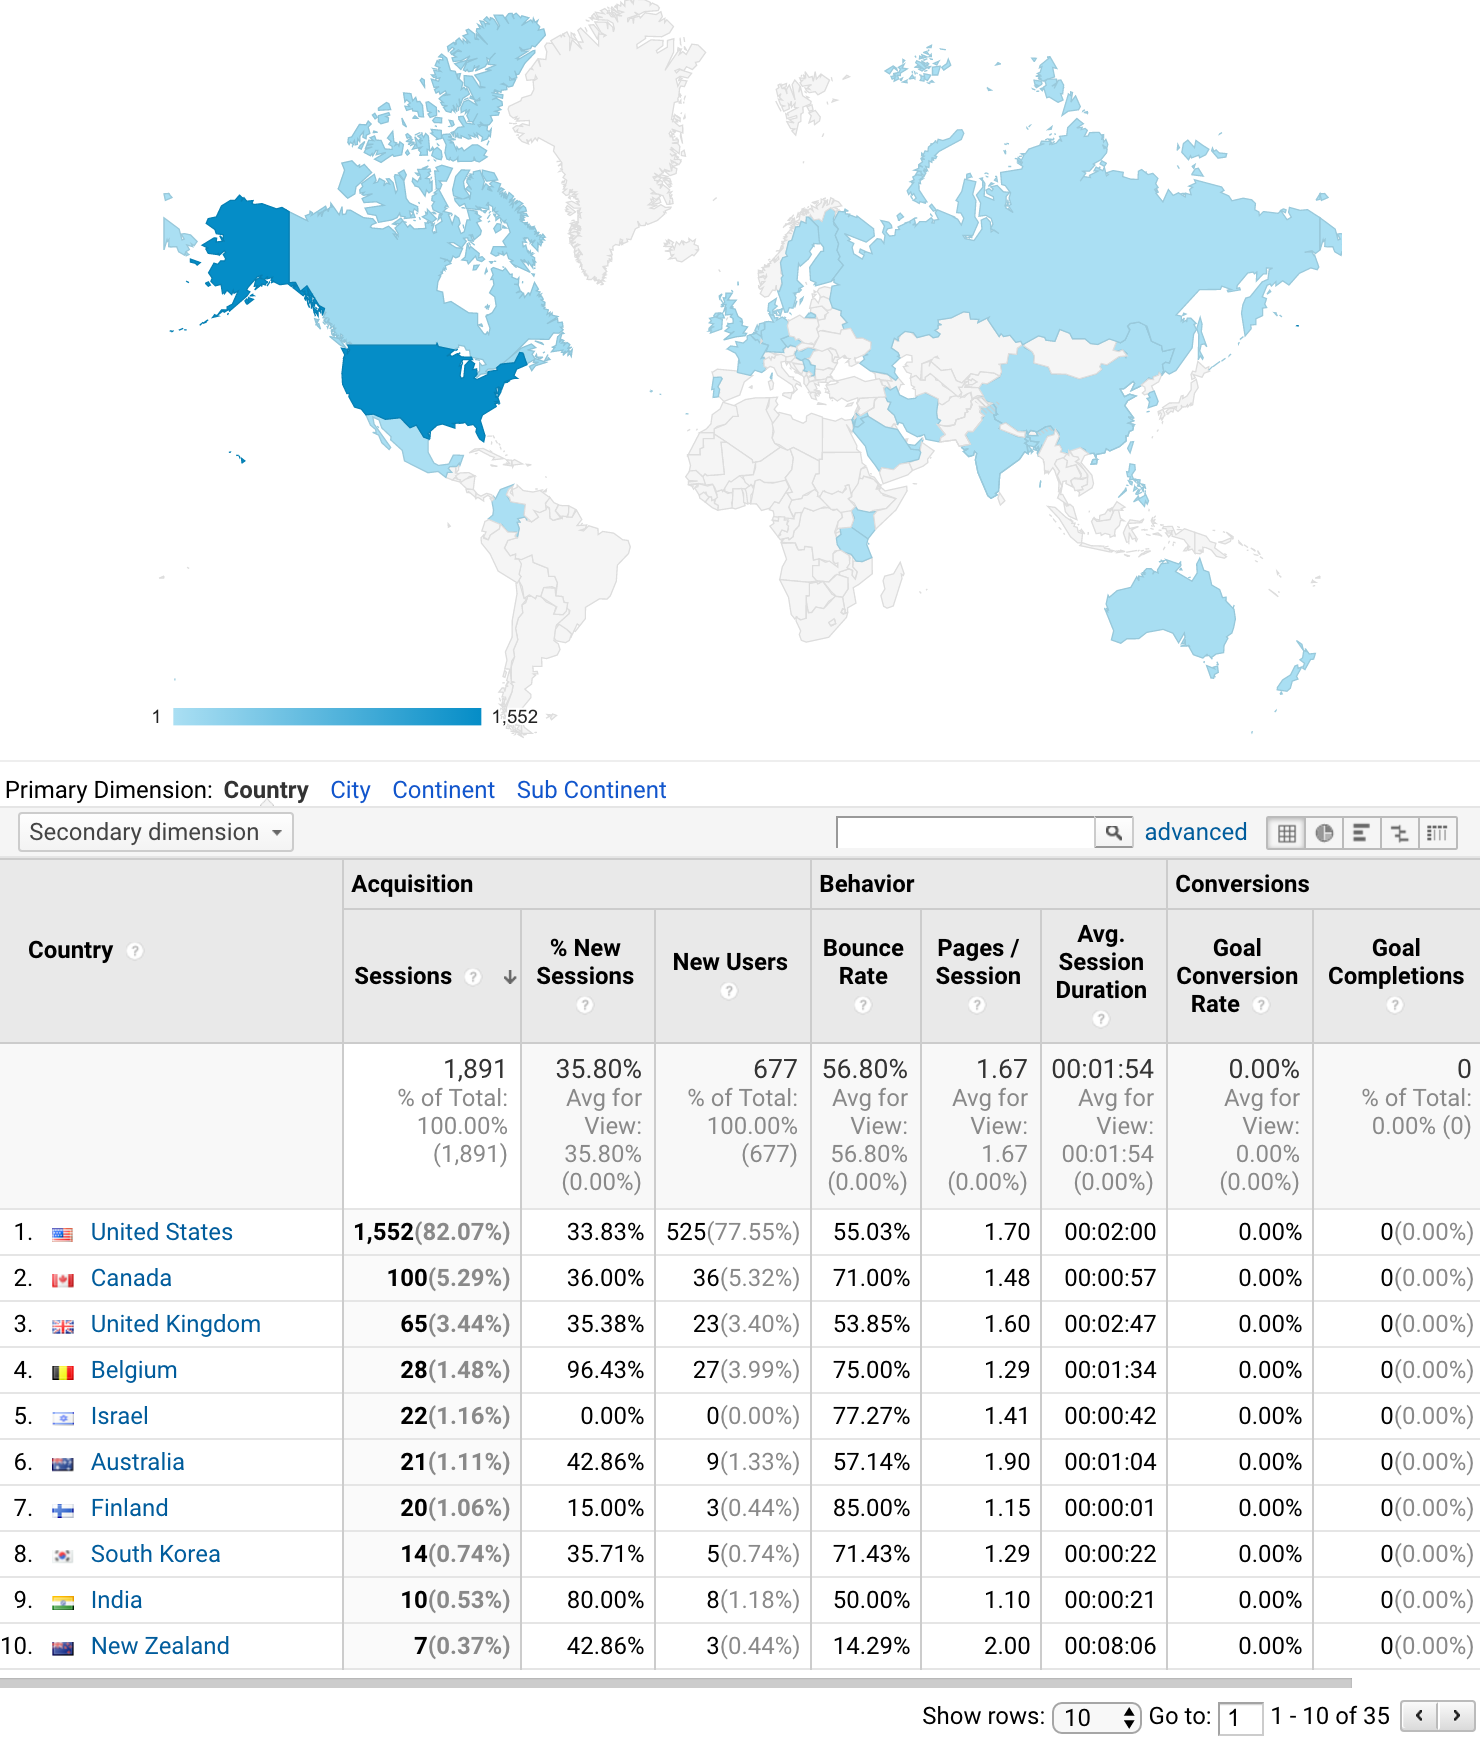
1,891 from Feb. 5 to March 4, 2017. Average about 68 visits per day, from 35 countries, speaking 23 languages. 36% were new visits. 57% access on desktop computer, 36% access with mobile device (iPhone, Android), 7% access with tablet.
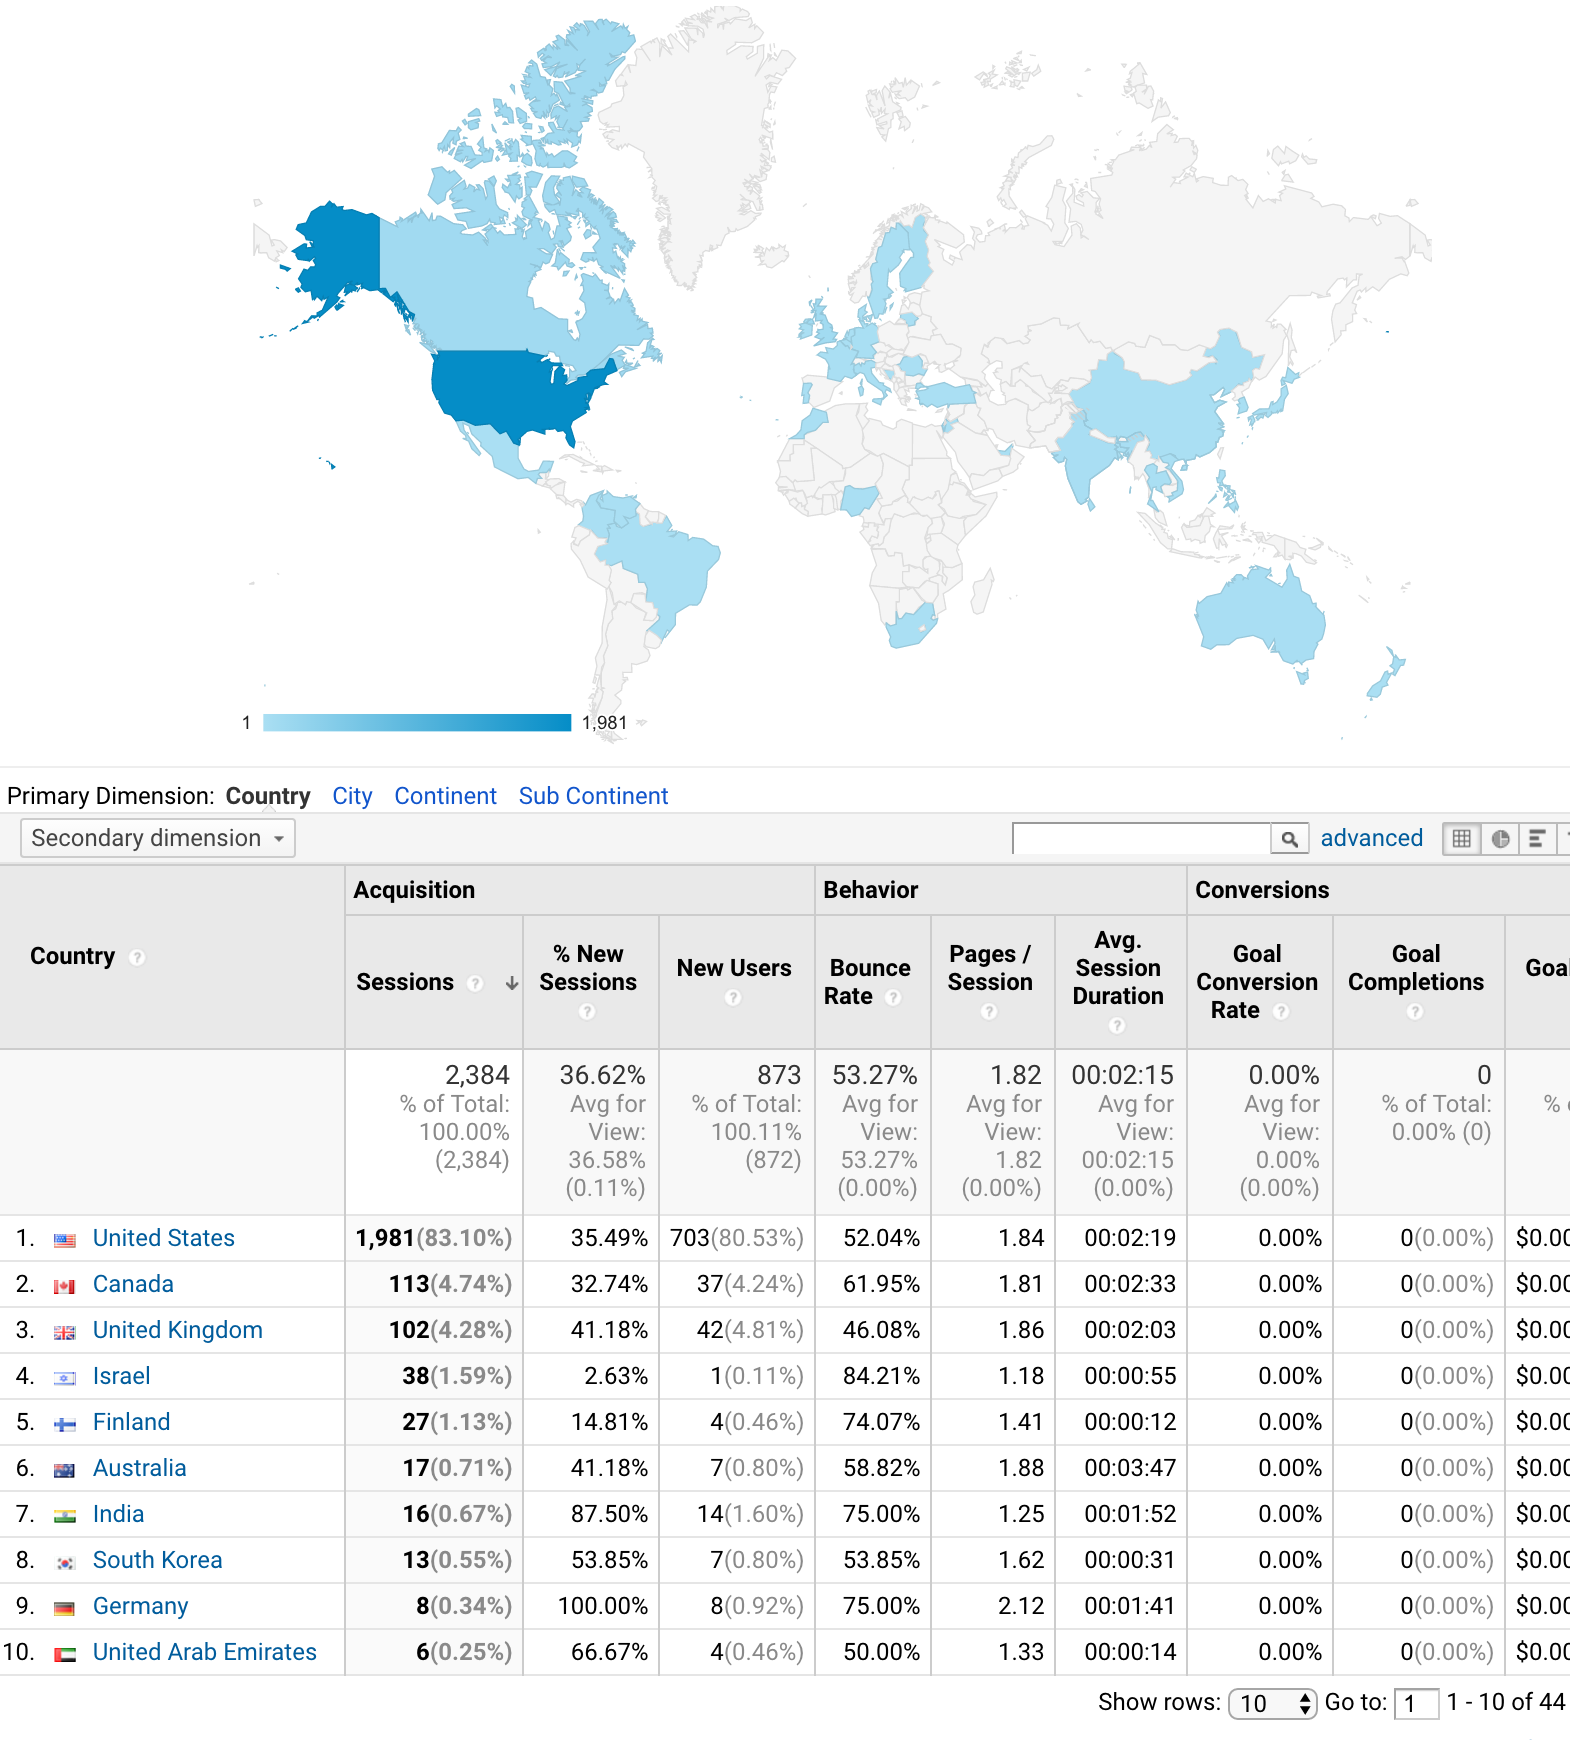
2,384 visitors from 44 countries around the world January 10 – February 11, 2017. Average about 77 visits per day, speaking 29 languages. 37% were new visits. 59% access on desktop computer, 34% access with mobile device (iPhone, Android), 7% access with tablet.
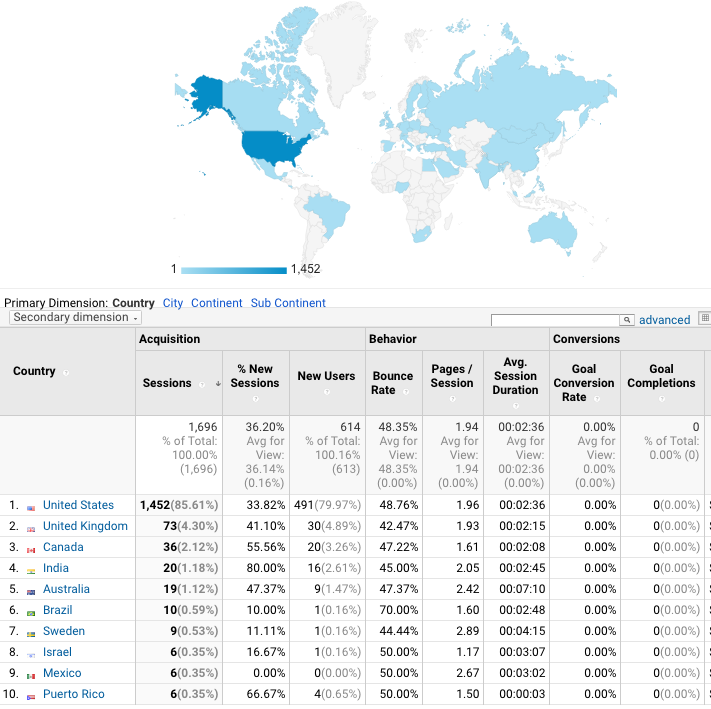
1,696 visits from 40 countries around the world December 8, 2016 through January 7, 2017. Average about 55 visits per day, speaking 25 languages. 36% were new visits. 56% access on desktop computer, 37% access with mobile phone (iPhone, Android), 6% access with tablet.
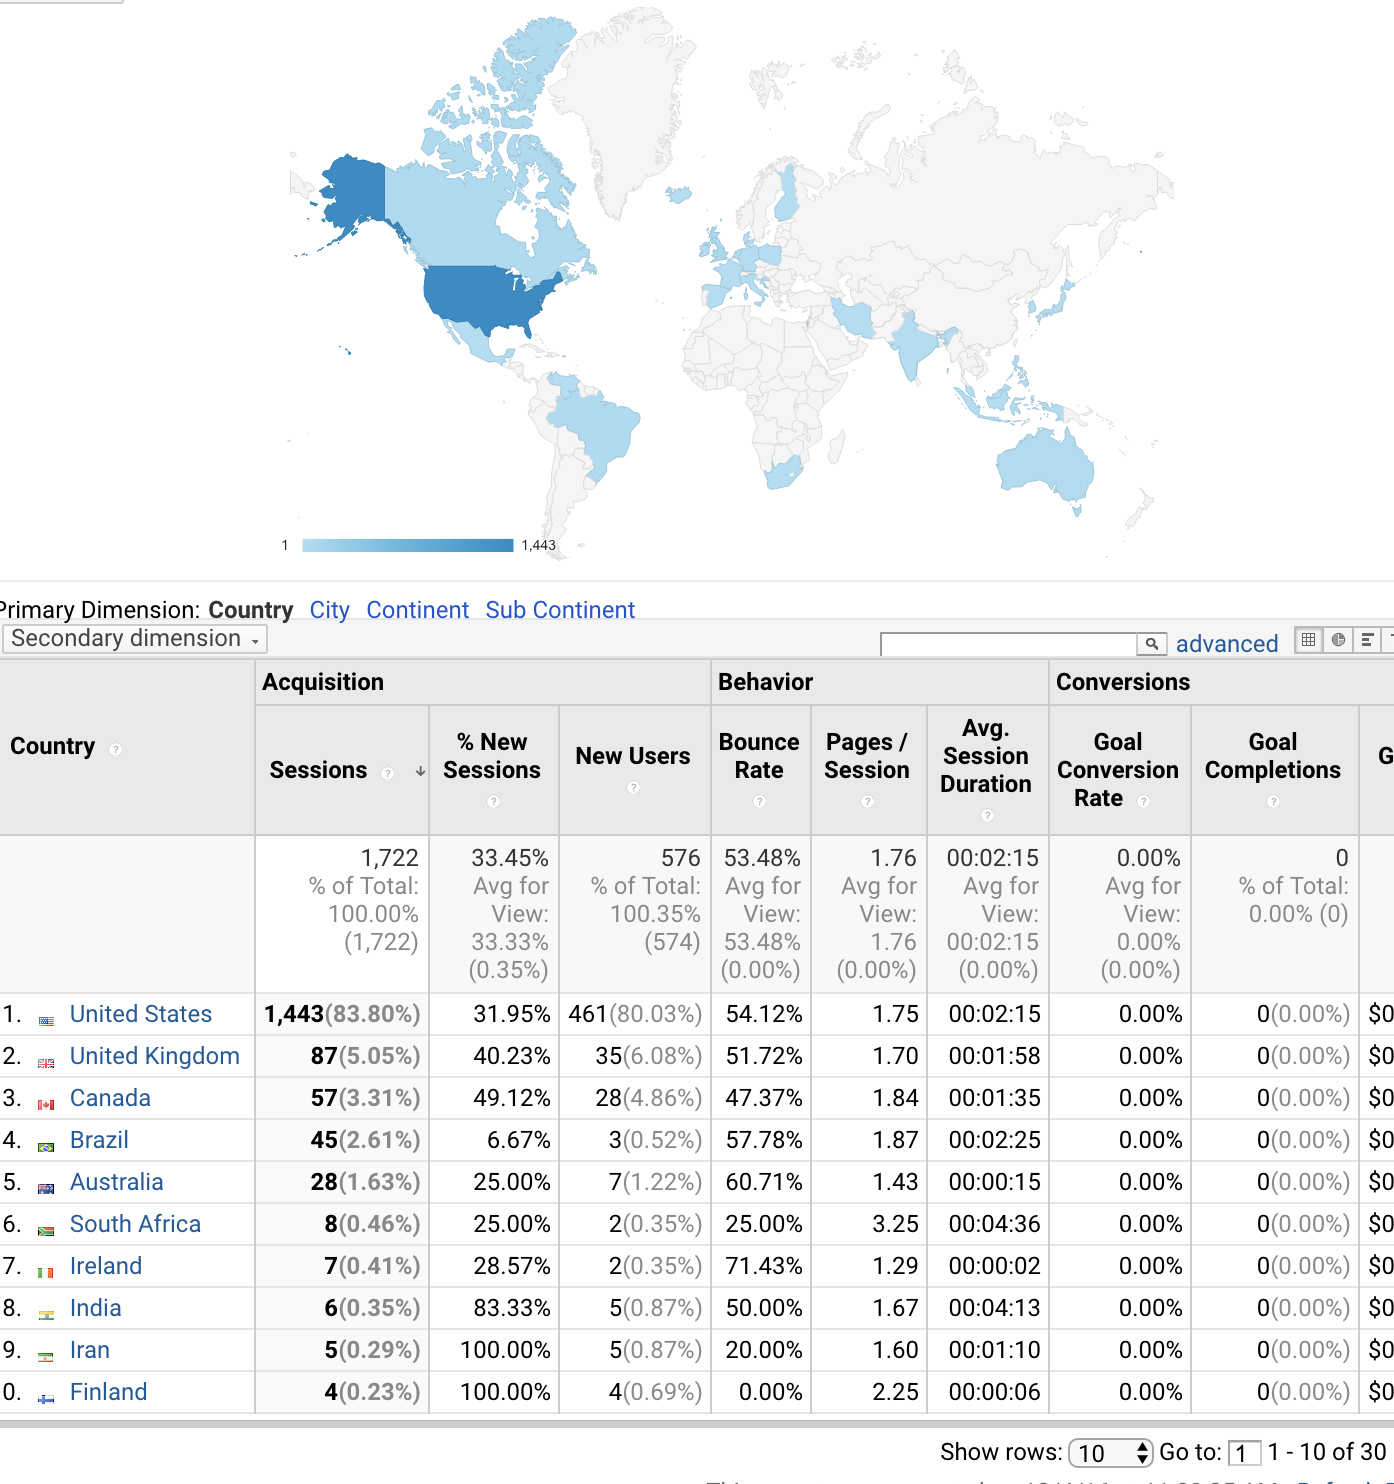
1,722 visitors from 30 countries around the world Nov. 3 – Dec 3, 2016. Average about 57 visits per day, speaking 23 languages. 33% were new visits. 53% access on desktop computer, 40% access with mobile device (iPhone, Android), 6% access with tablet. Visits are down, but access with mobile devices has risen again.
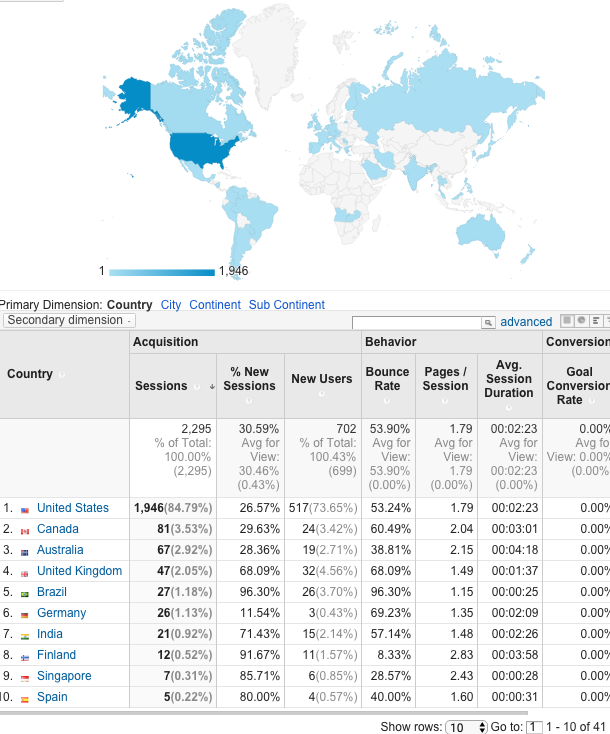
2,295 visitors from 41 countries around the world June 5 through July 10, 2016. Average about 68 visits per day, speaking 30 languages. 30% were new visits. 55% access on desktop computer, 37% access with mobile phone (iPhone, Android), 8% access with tablet. Continuing to increase mobile device access.
2,071 visitors from 45 countries around the world May 5 through June 4, 2016. Average about 67 visits per day, speaking 33 languages. 33% were new visits. 57% access on desktop computer, 36% access with mobile phone (iPhone, Android), 7% access with tablet.
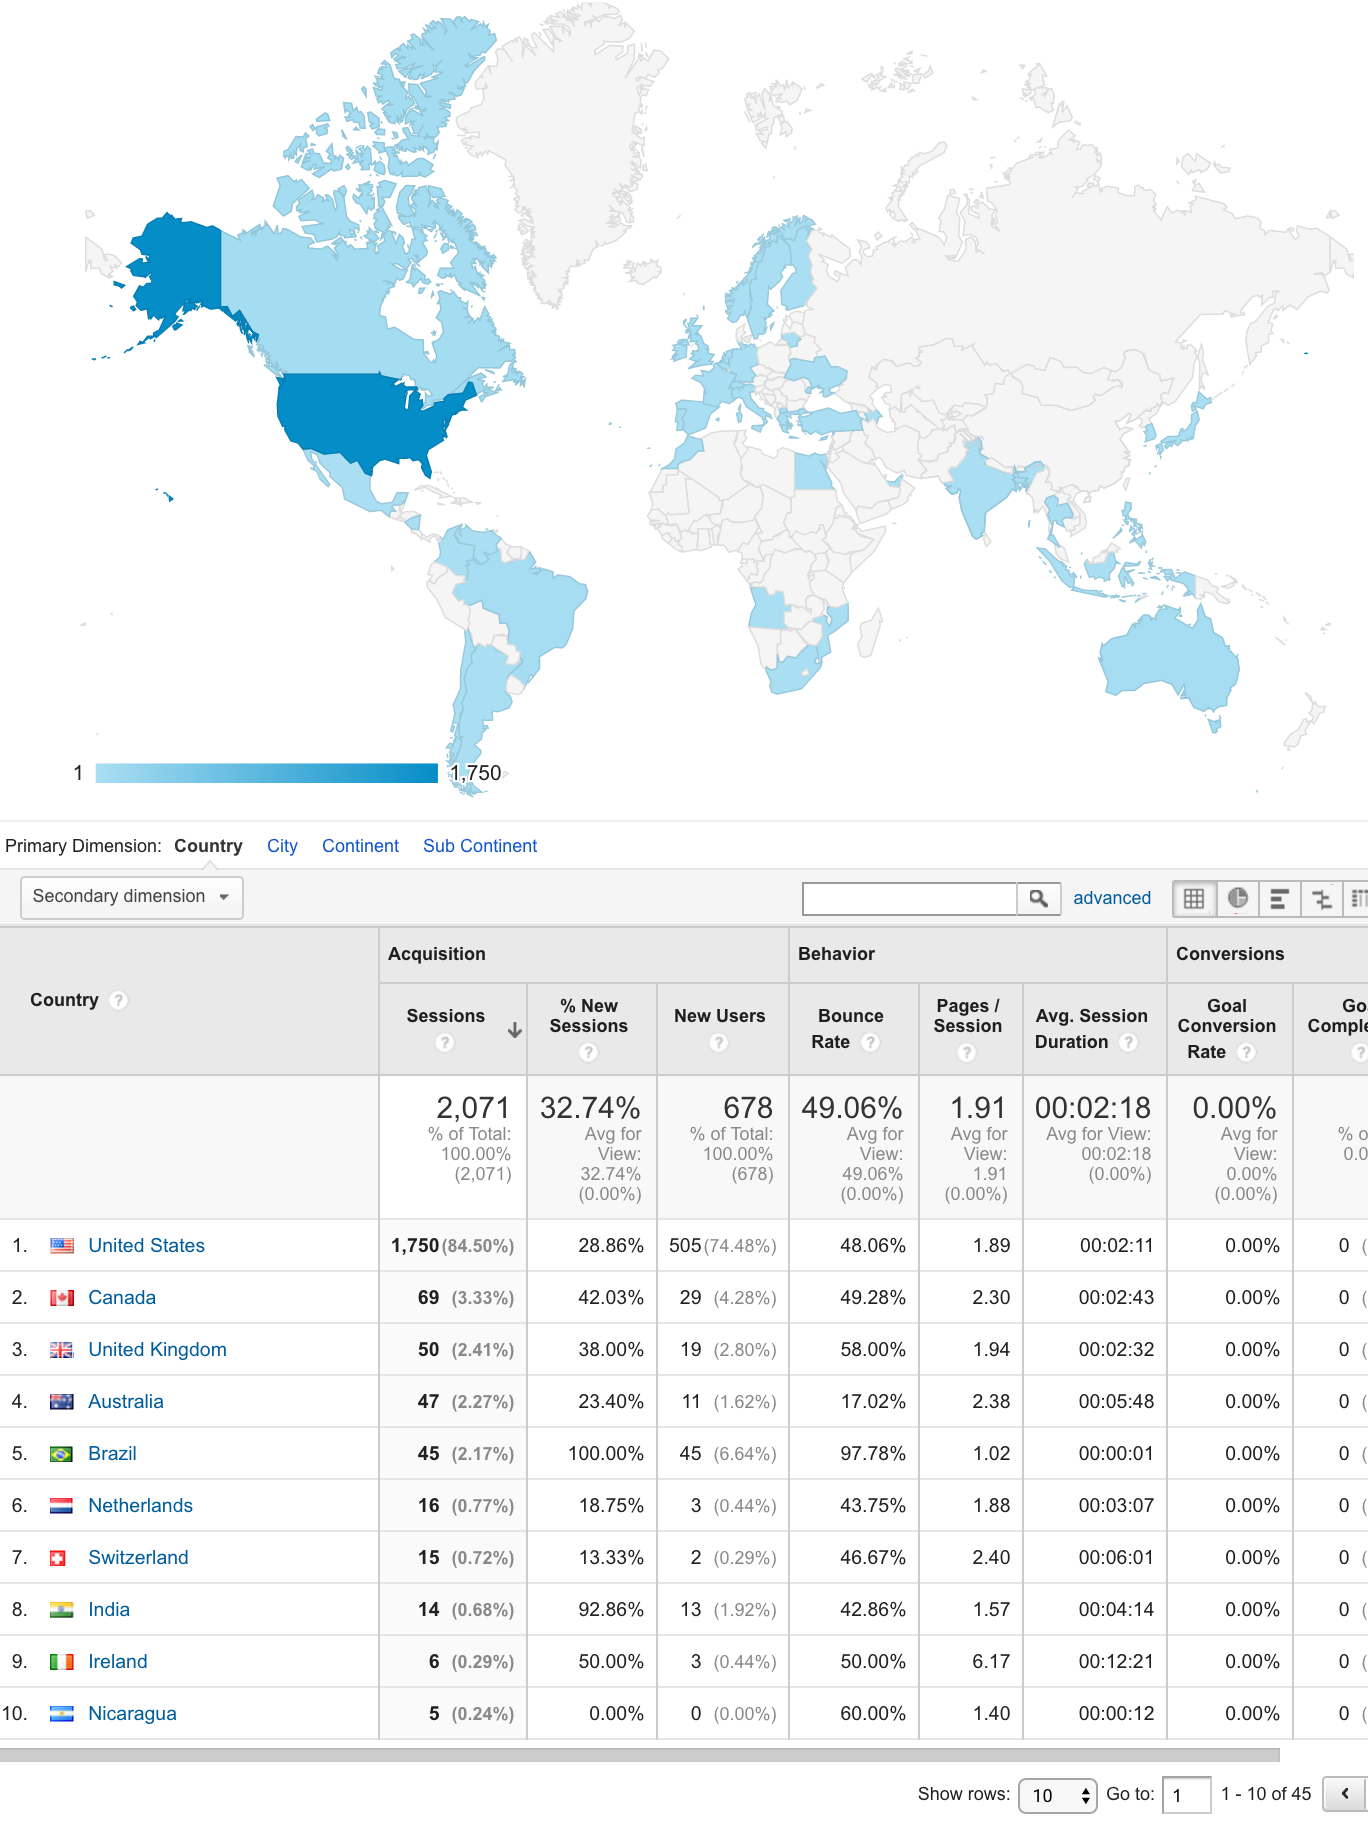
1,993 visitors from 39 countries around the world Mar 31, 2016–Apr 30, 2016. Average about 65 visits per day, speaking 34 languages. 36% were new visits. 58% access on desktop computer, 32% access with mobile device (iPhone, Android), 9% access with tablet. Interestingly, the tablet users viewed more pages and spent more time on our website than desktop or smart phone users.

2,031 visitors from 36 countries around the world March 3, 2016 through April 2, 2016. Average about 66 visits per day, speaking 24 languages. 35% were new visits. 58% access on desktop computer, 33% access with mobile device (iPhone, Android), 9% access with tablet.

1,954 visitors from 42 countries around the world October 1, 2015 through October 31, 2015. Average about 63 visits per day, speaking 31 languages. 40% were new visits (all increase). 52% access on desktop computer (decrease), 34% access with mobile phone (iPhone, Android) (increase), 14% access with tablet,(increase). Continuing to increase mobile device access.
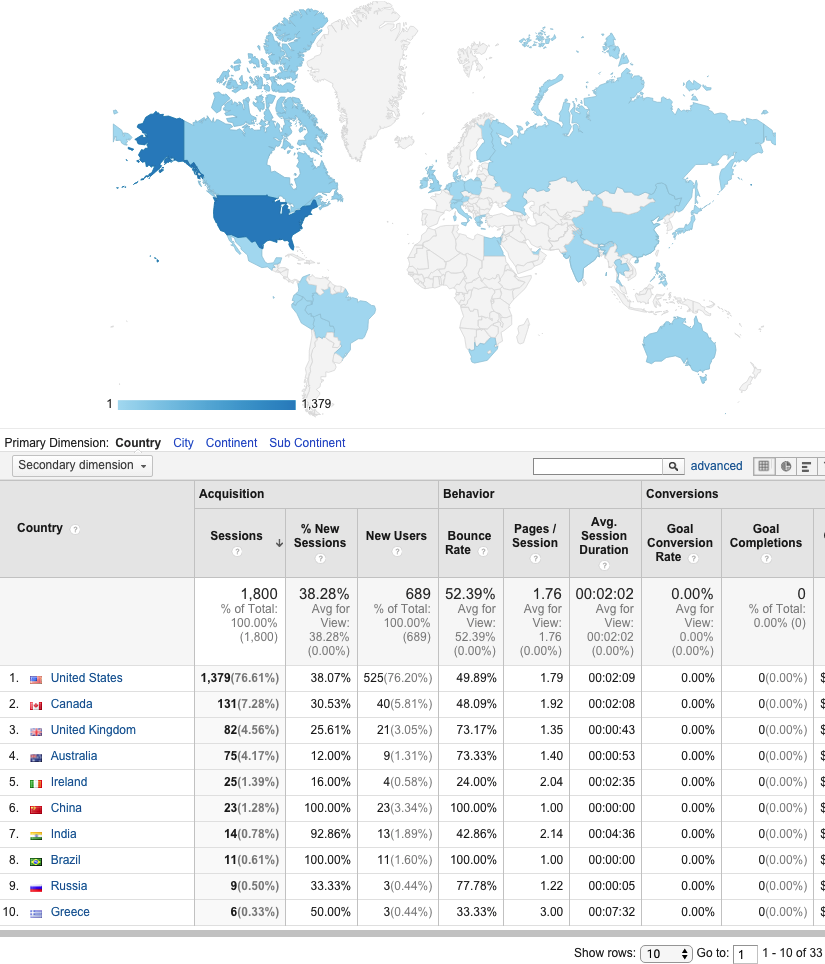
1,800 visitors from 33 countries around the world August 13, 2015 through September 13, 2015. Average about 60 visits per day, speaking 25 languages. 38% were new visits (increase). 60% access on desktop computer (steady), 30% access with mobile phone (iPhone, Android) (increase), 9% access with tablet (decrease). Continuing to increase mobil phone access.
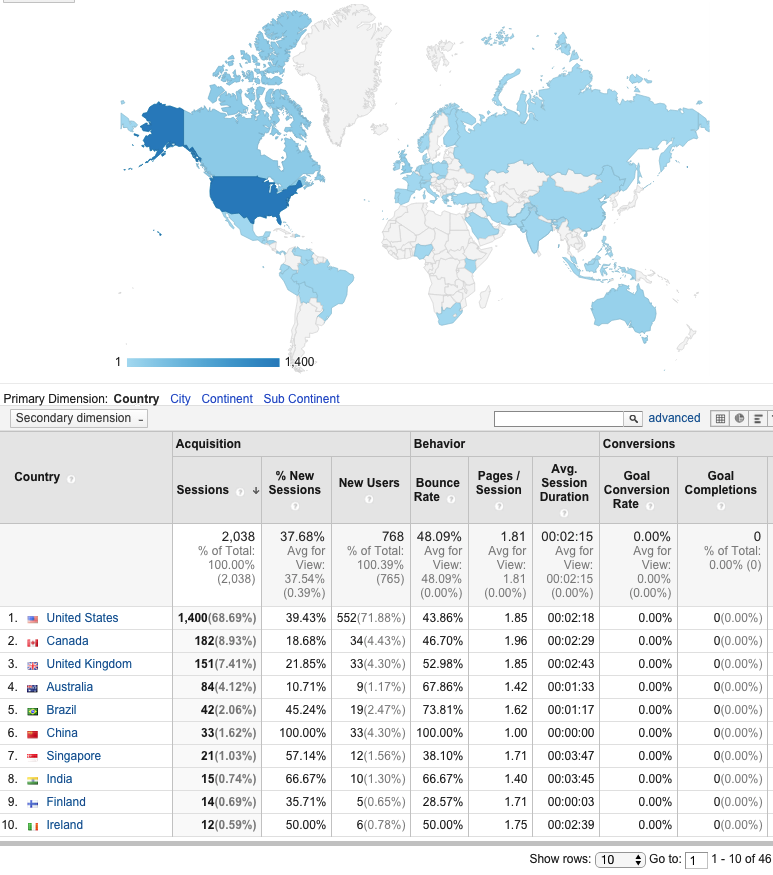
2,038 visitors from 46 countries around the world July 2, 2015 through August 1, 2015. Average about 66 visits per day, speaking 28 languages. 37% were new visits. 60% access on desktop computer (decrease), 28% access with mobile device (iPhone, Android)(increase), 12% access with tablet. Continuing to increase mobile device access and decrease desktop computer access.
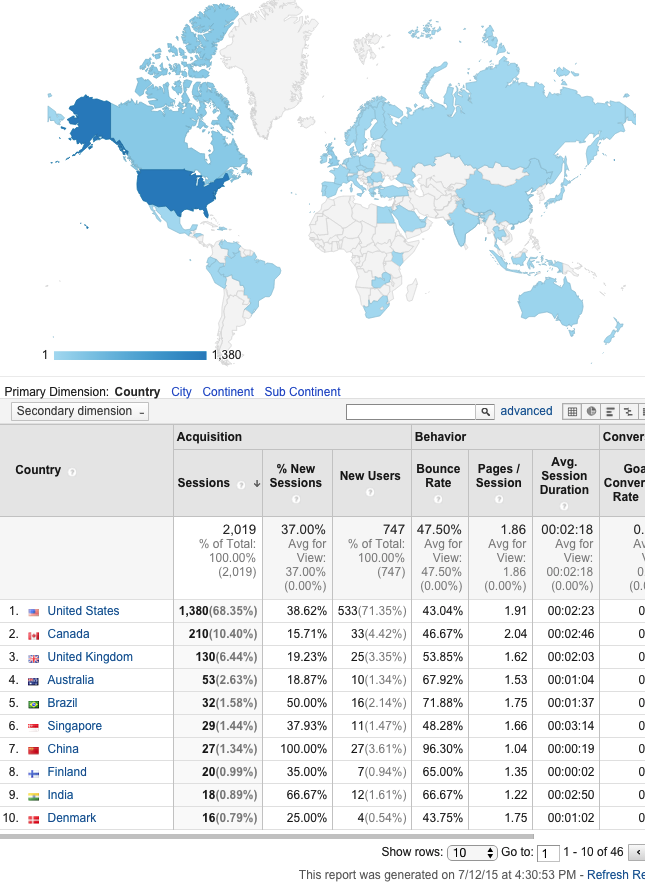
2,019 visitors from 46 countries around the world June 11, 2015 through July 11, 2015. Average about 67 visits per day, speaking 31 languages. 37% were new visits. 61% access on desktop computer (decrease), 26% access with mobile device (iPhone, Android)(increase), 12% access with tablet (decrease). Continuing to increase mobile device access and decrease desktop computer access.
Please note that users from Finland, Denmark and Singapore have visited our website. Word is getting around!
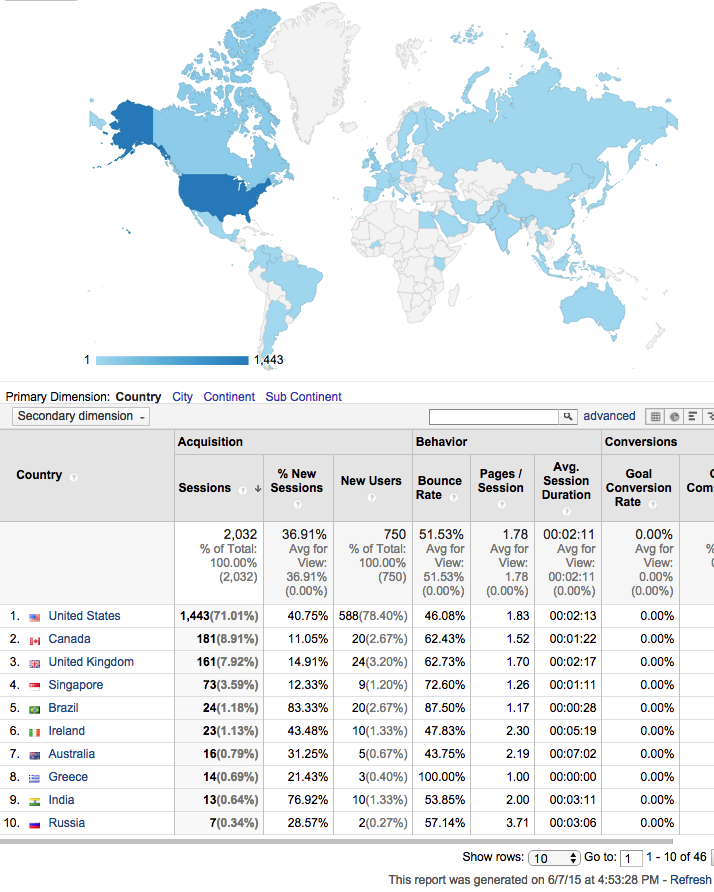
2,032 visitors from 46 countries around the world May 7, 2015 through June 6, 2015. Average about 65 visits per day, speaking 32 languages. 37% were new visits. 63% access on desktop computer (decrease), 22% access with mobile device (iPhone, Android)(increase), 15% access with tablet (increase). Continuing to increase mobile device access and decrease desktop computer access.
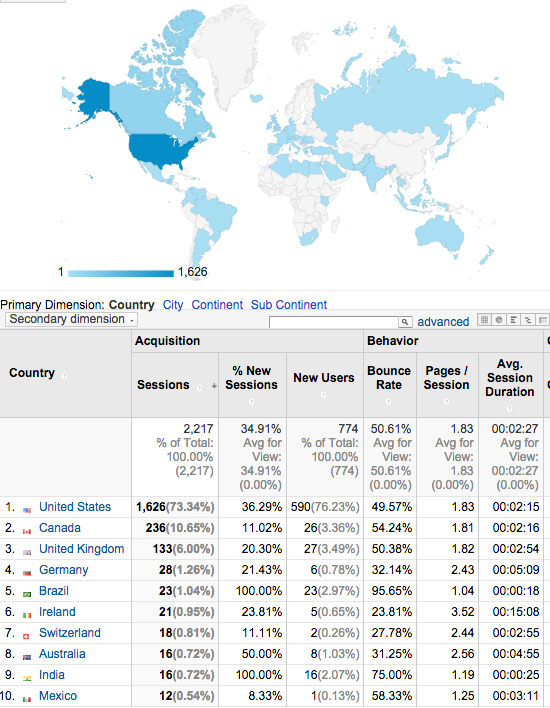
2,217 visitors from 54 countries around the world March 29, 2015 through April 28, 2015. This is another marked increase. Average about 72 visits per day, speaking 35 languages. 35% were new visits. 66% access on desktop computer (decrease), 20% access with mobile device (iPhone, Android)(increase), 14% access with tablet (increase)
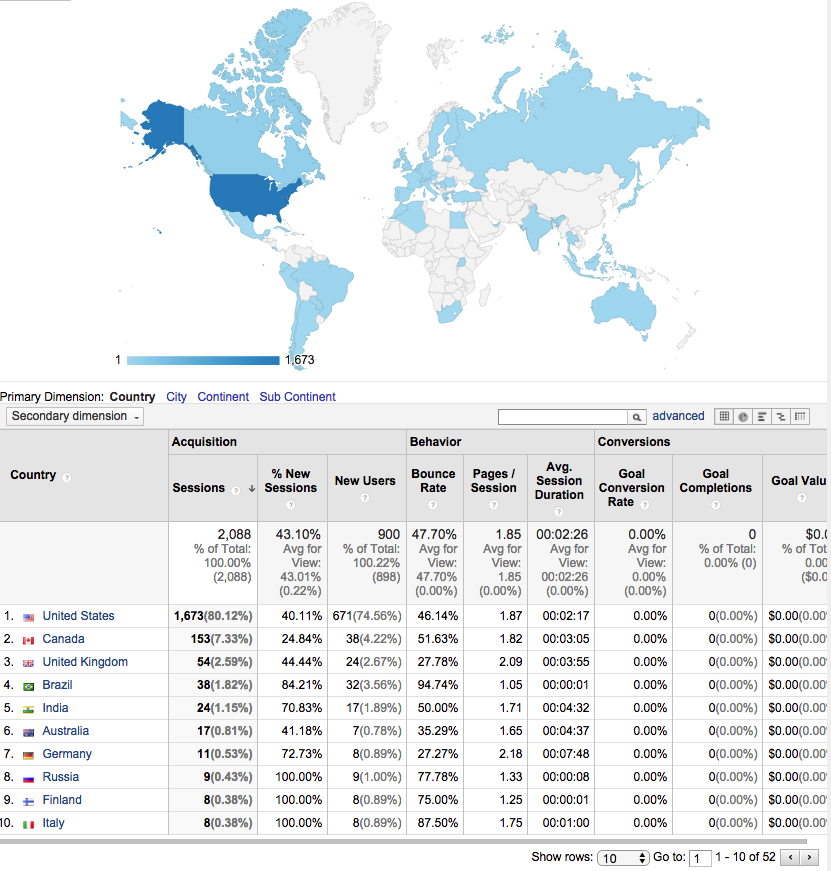
2,088 visitors from 52 countries around the world January 8, 2015 through February 7, 2015. This is a marked increase. Average about 67 visits per day, speaking 52 languages. 45% were new visits. 69% access on desktop computer (decrease), 19% access with mobile device (iPhone, Android)(increase), 12% access with tablet
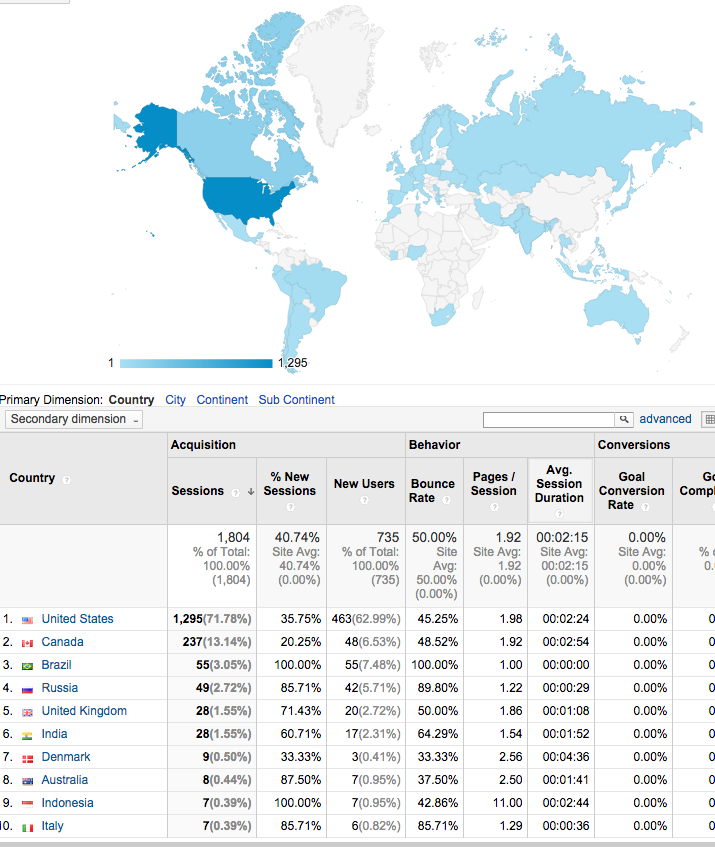
1,804 visitors from 52 countries around the world December 4, 2014 through January 3, 2015. This is a marked increase. Average about 58 visits per day, speaking 40 languages. 41% were new visits. 71% access on desktop computer (increase), 16% access with mobile device (iPhone, Android), 12% access with tablet (increase)
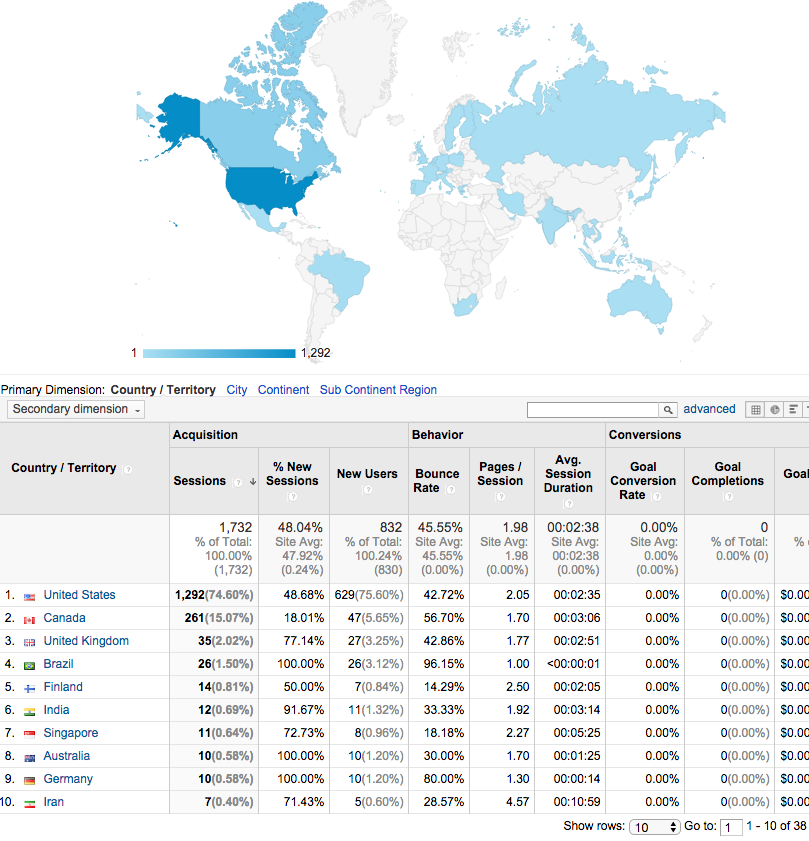
1,732 visitors from 38 countries around the world October 2, through November 1, 2014. Average about 55 visits per day, speaking 33 languages. 48%, or 832 new visits. 67% access on desktop computer (decrease), 23% access with mobile device (iPhone, Android), 10% access with tablet.
1,929 visitors from 49 countries around the world September 4, through October 4, 2014. Average over 60 visits per day, speaking 35 languages. 41%, or 787 new visits. 73% access on desktop computer (decrease), 19% access with mobile device (iPhone, Android), 8% access with tablet.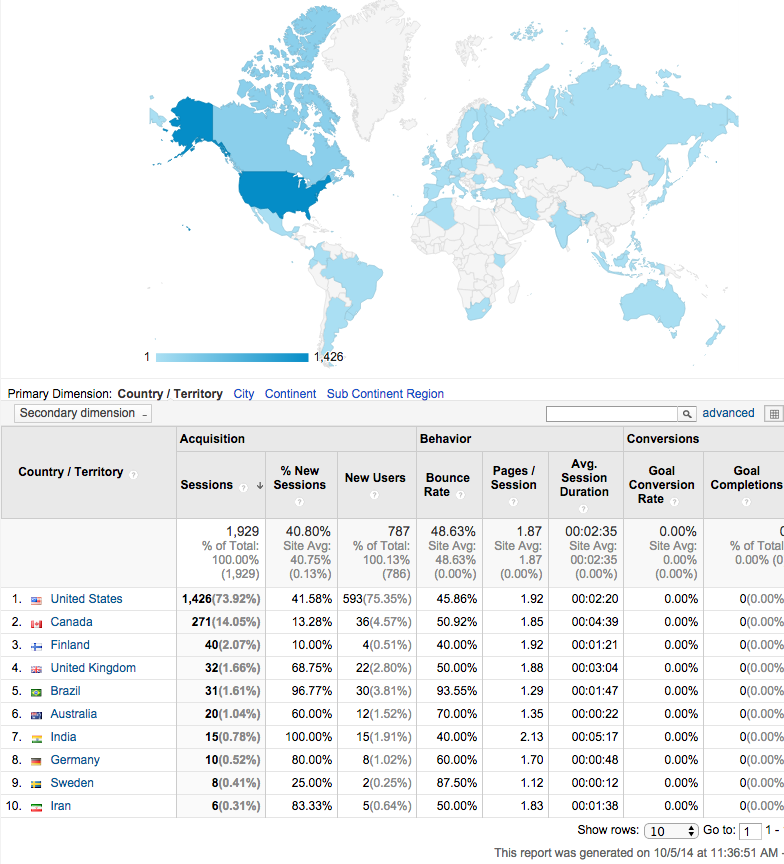
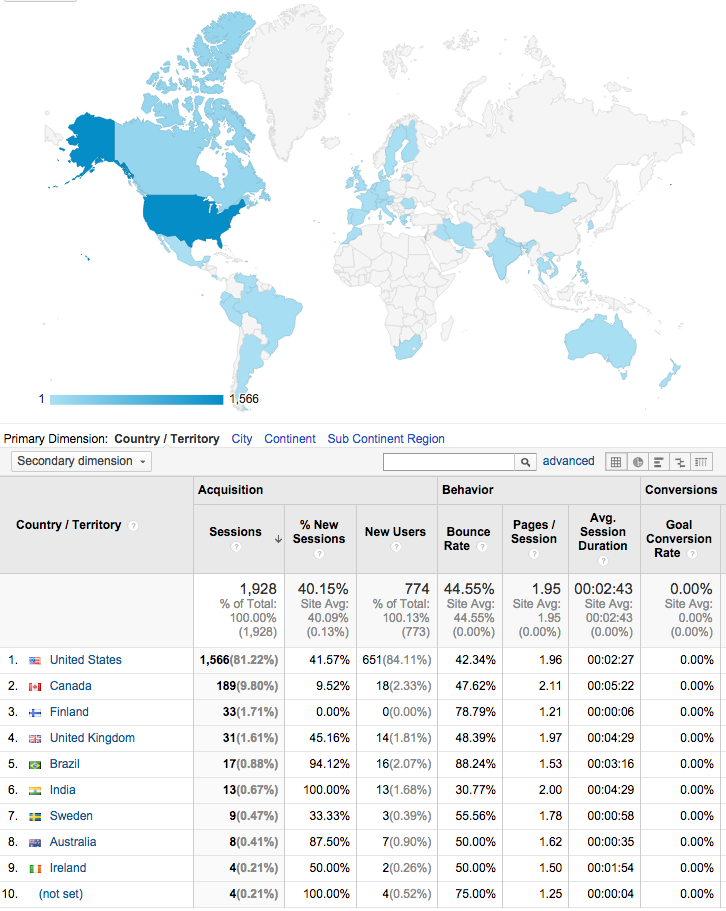
1,928 visitors from 47 countries around the world August 7 through September 6, 2014. Average over 60 visits per day, speaking 31 languages. 40%, or 774 new visits. 76% access on desktop computer, 17% access with mobile device (iPhone, Android), 7% access with tablet.
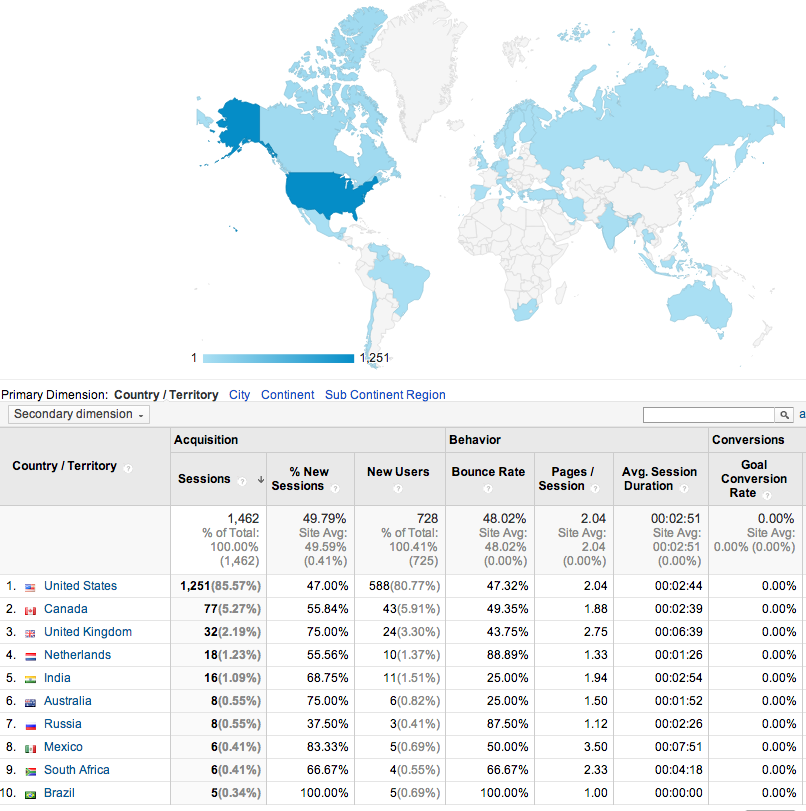
1,462 Visitors from 33 countries around the world June 5 through July 5, 2014. Average ~50 per day, speaking 26 languages. Almost 50%, or 728 new visits. 75% access on desktop computer, 18% access with mobile device (iPhone, Android), 8% access with tablet.
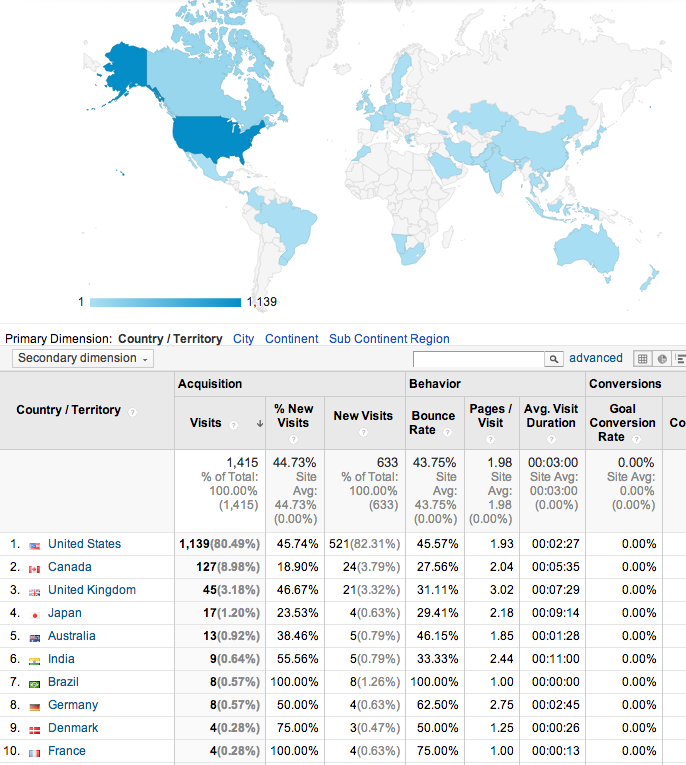
1,415 Visitors from 40 countries around the world March 6 through April 5, 2014. Average 50+ per day, speaking 31 languages. Over 40%, or 633 new visits. 80% access on desktop computer, 11% access with mobile device (iPhone, Android), 8% access with tablet.
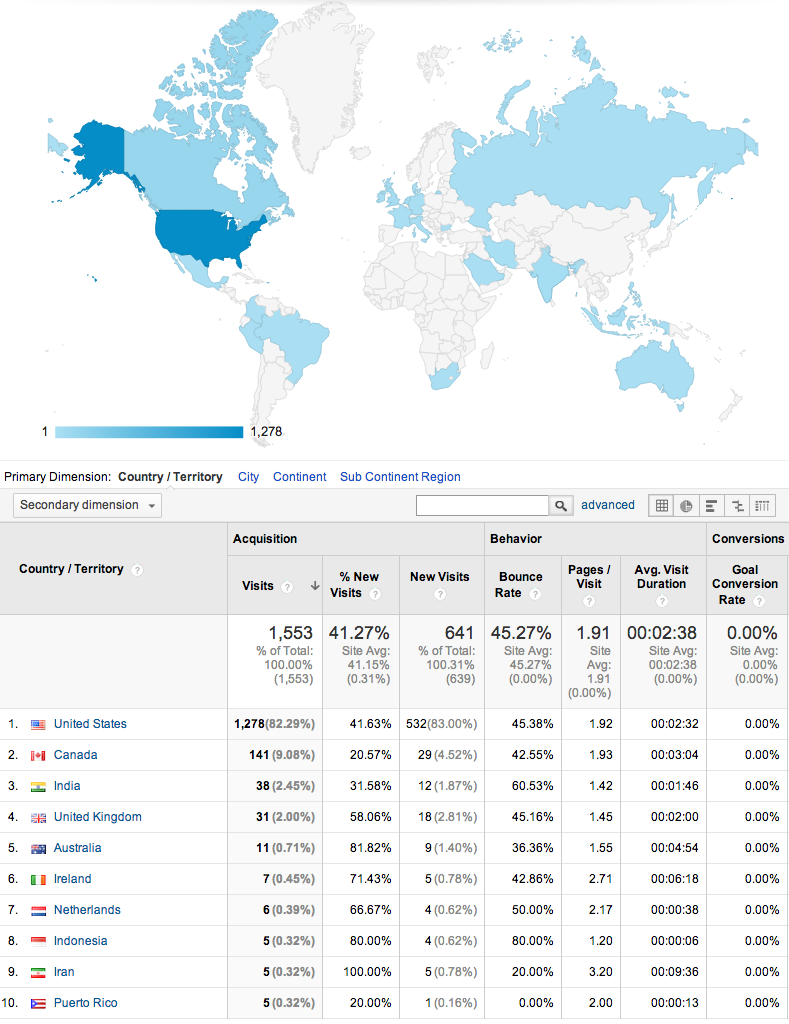
1,553 Visitors from 27 countries around the world January 30 through March 1, 2014. Average 50+ per day, speaking 13 languages. Over 40%, or 641 new visits. 76% access on desktop computer, 12% access with mobile device (iPhone, Android), 10% access with tablet.
1,532 Visitors from 25 countries around the world January 9 through February 8, 2014. Average 50 per day, speaking 16 languages.
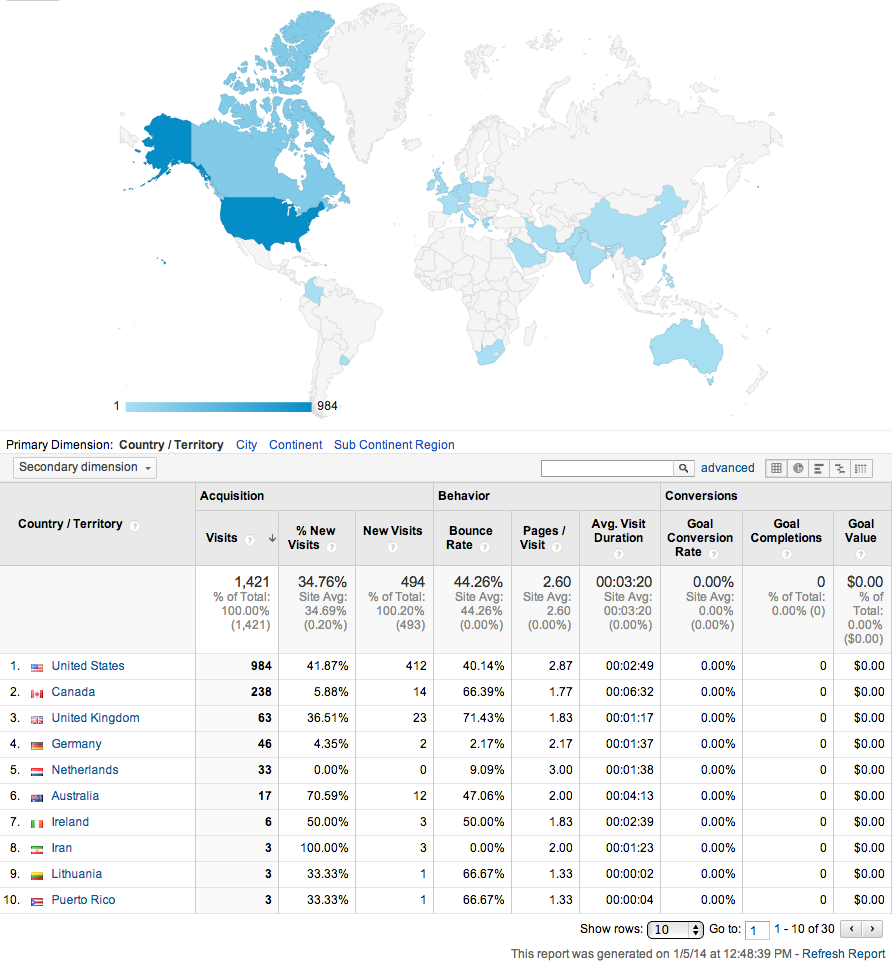
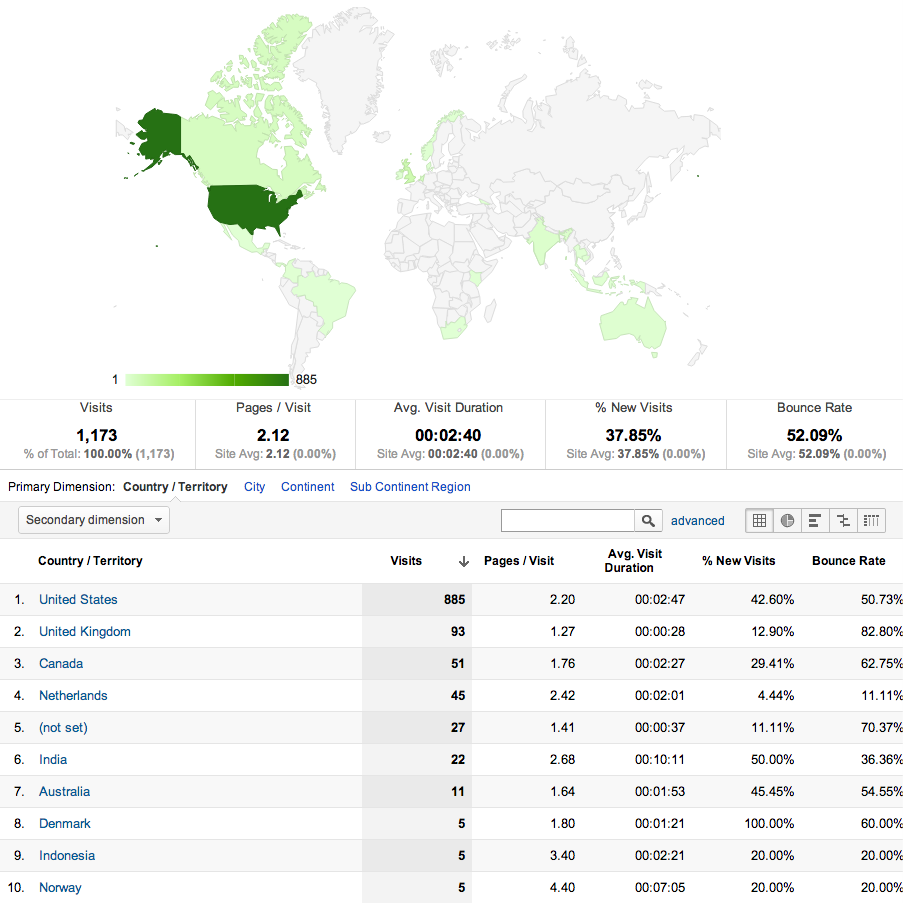
1,421 visits December 4, 2013 thru January 4, 2014, up 300 visits from last month, about 1/3 were new visits. Visitors came from 30 countries, up from 25 last month. There were a large number of new UK visitors. Over 1200 visitors used desktop computers, over 100 were on mobile devices, and 93 accessed our site from tablets
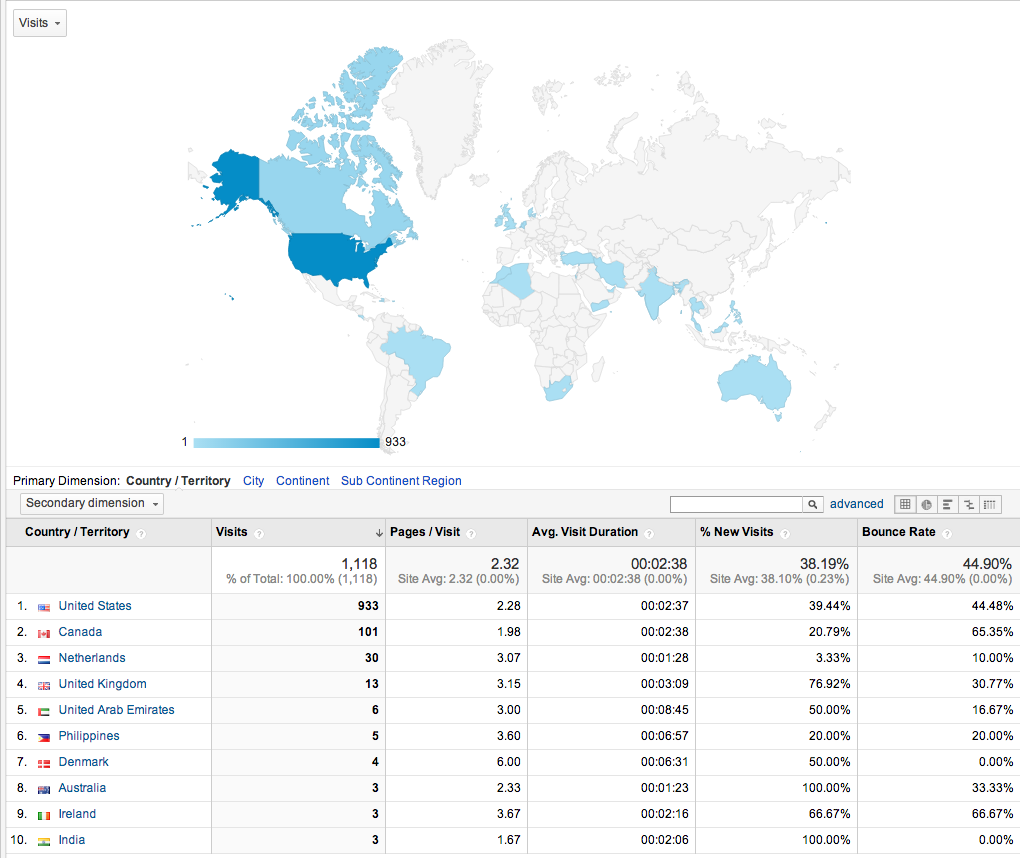
1,118 Visitors from 25 countries around the world October 31 to November 30, 2013. 12 languages spoken. Over 1/3 are new visits, 2/3 are return visits. 37% access on desktop computer, 46% access with mobile device, 32% access with tablet.
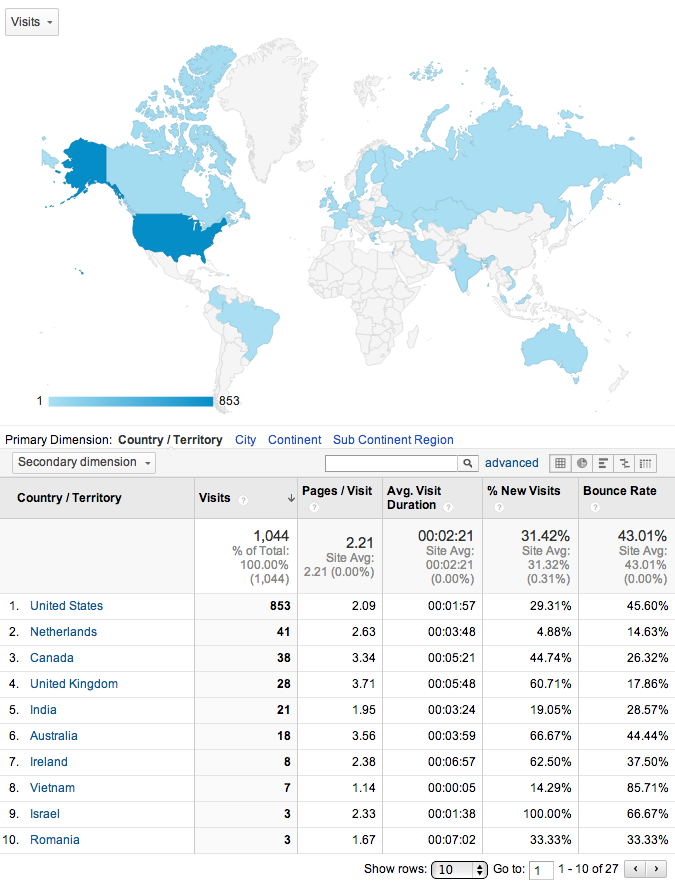
Visitors from 27 countries around the world September 5 to October 5, 2013. The top 10 visits were from US, Netherlands, Canada, UK, India, Australia, Ireland, Vietnam, Israel and Romania, using 8 Languages besides English.
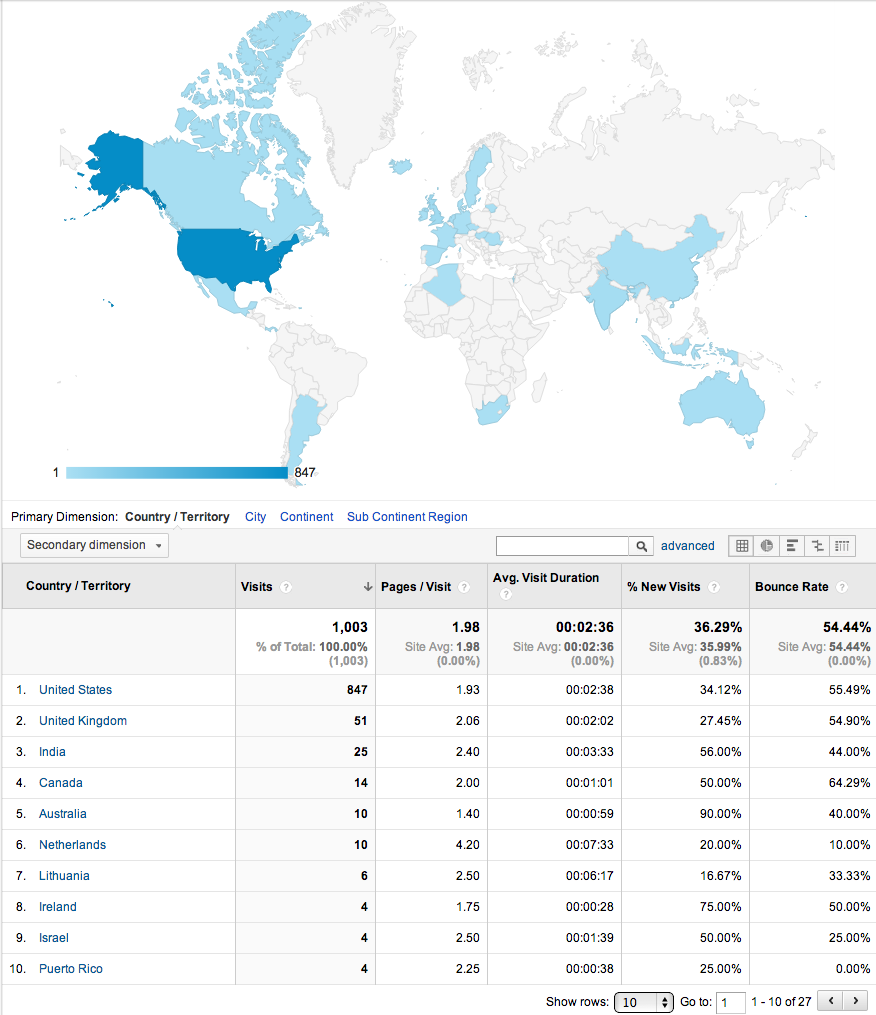
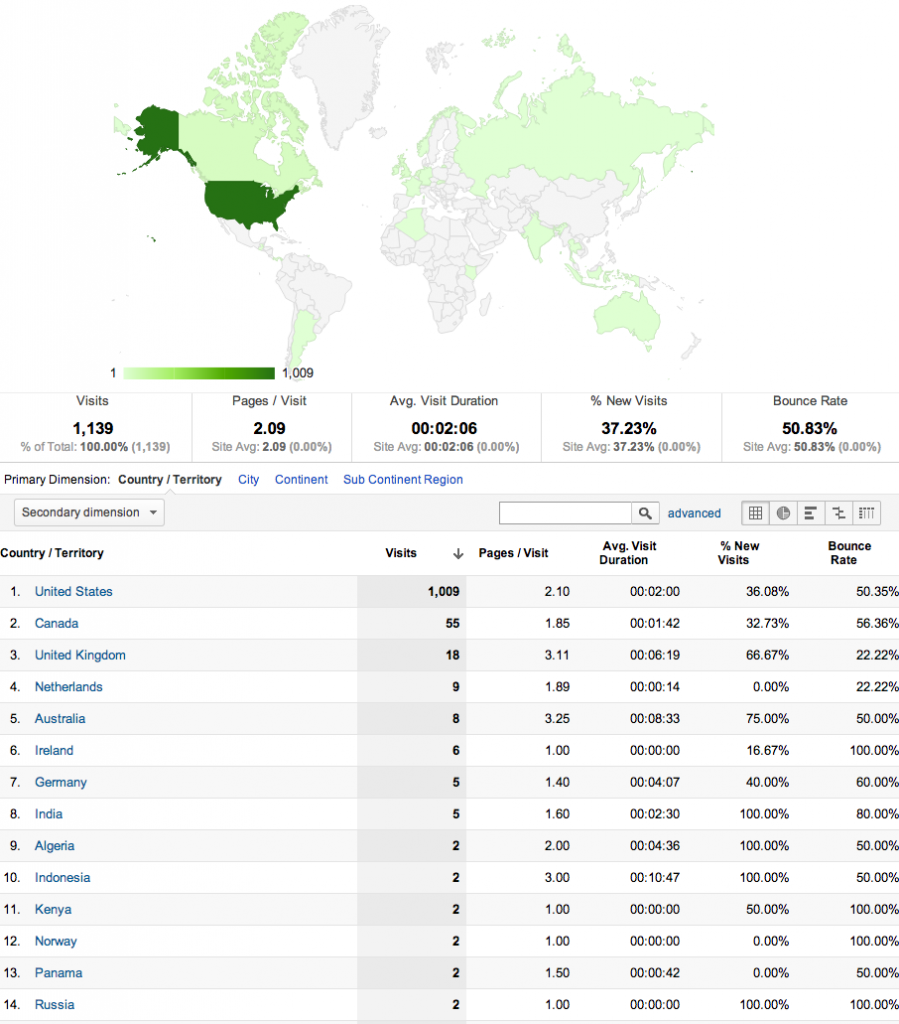
Visitors from 22 countries around the world August 8 to September 2, 2013. Visitors came from 48 states around the US (all but Wyoming and Nevada).
Visitors from various countries around the world July 4 to August 3, 2013.
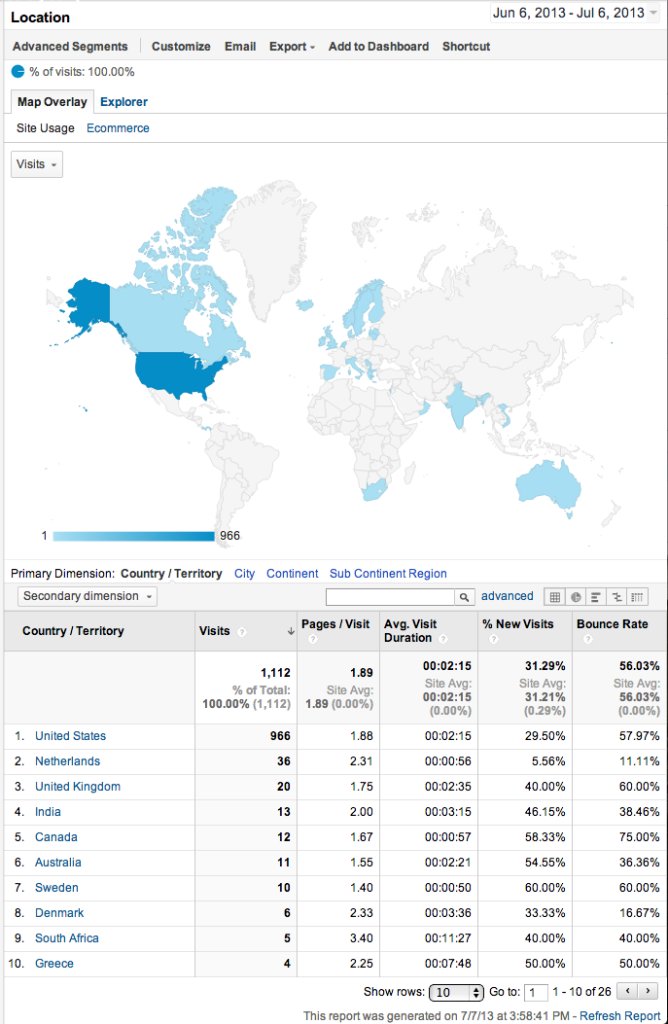
Visitors from various countries around the world June 6 to July 6, 2013.
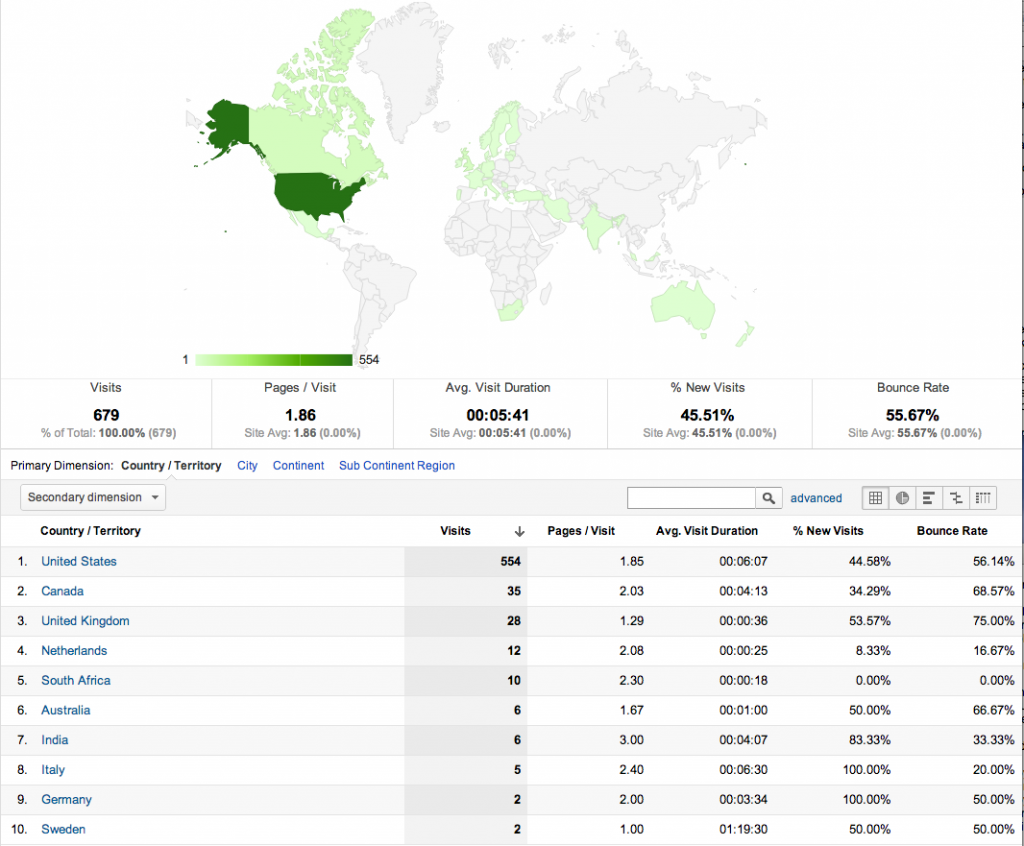
Visitors from various countries around the world March 7 to April 6, 2013.
Visitors from various countries around the world January 10, 2013 to February 9, 2013.
Note: The Calendar of Meetings was moved to this website during this time, hence the spike in the number of visits.
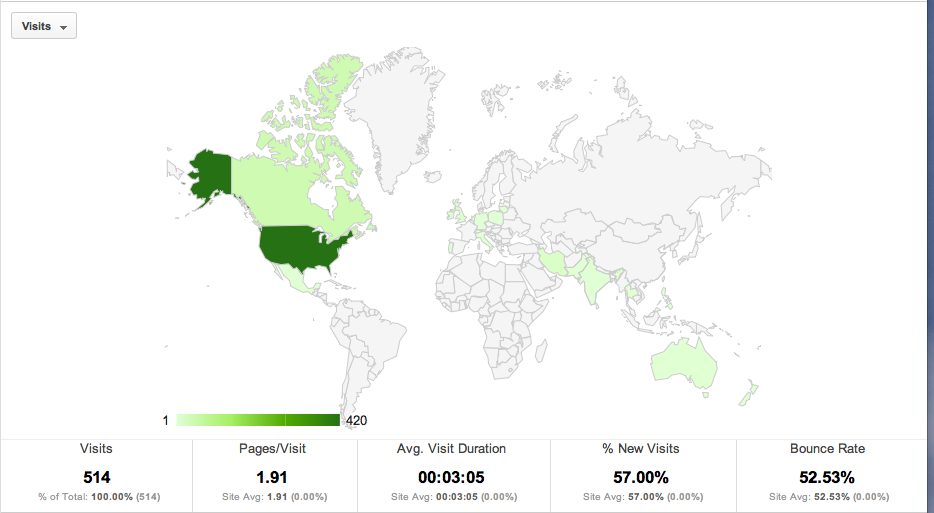
Visitors from various countries around the world December 6, 2012 to January 5, 2013
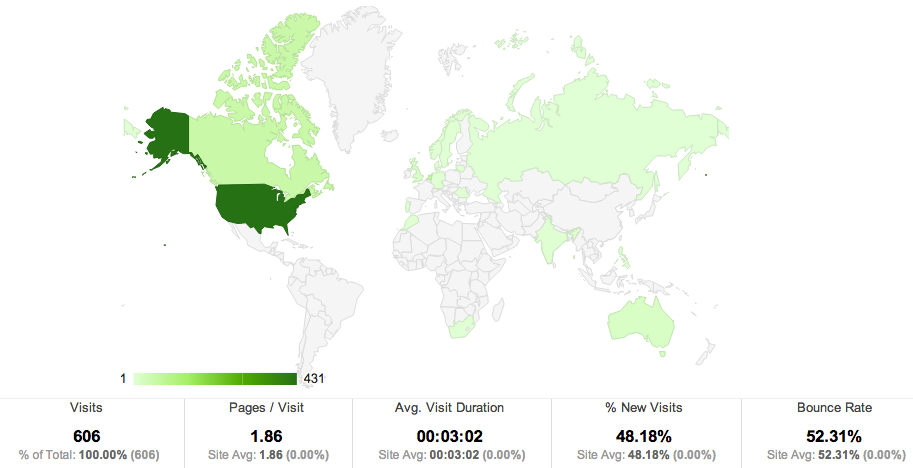
Visitors from various countries around the world October 11 to November 10, 2012
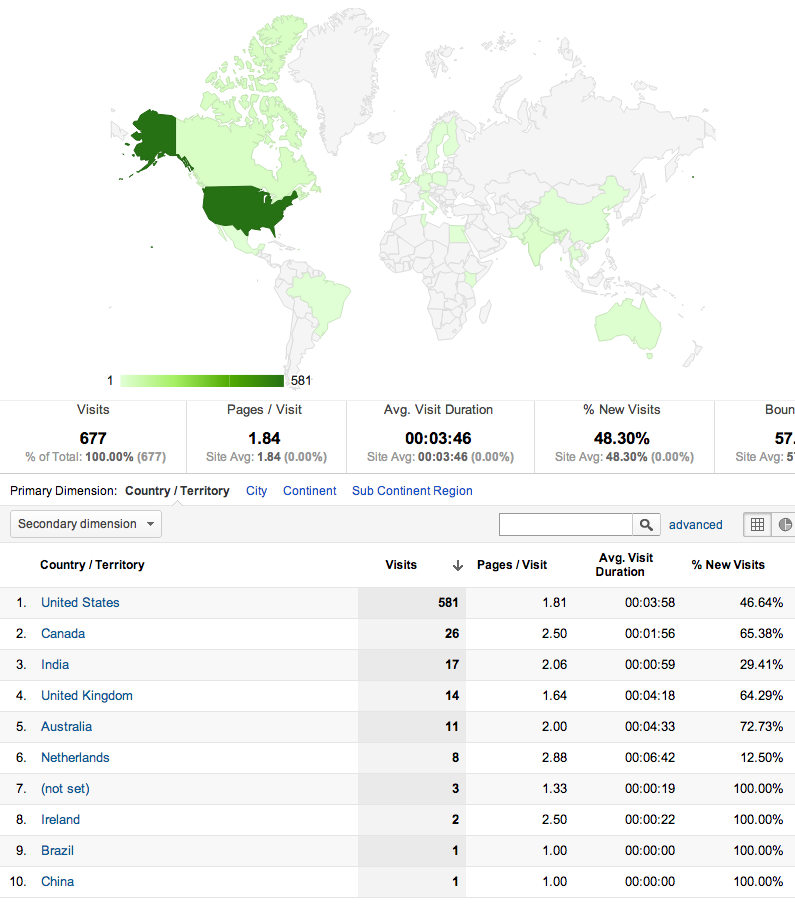
Countries of visitors from October 11 to November 10, 2012
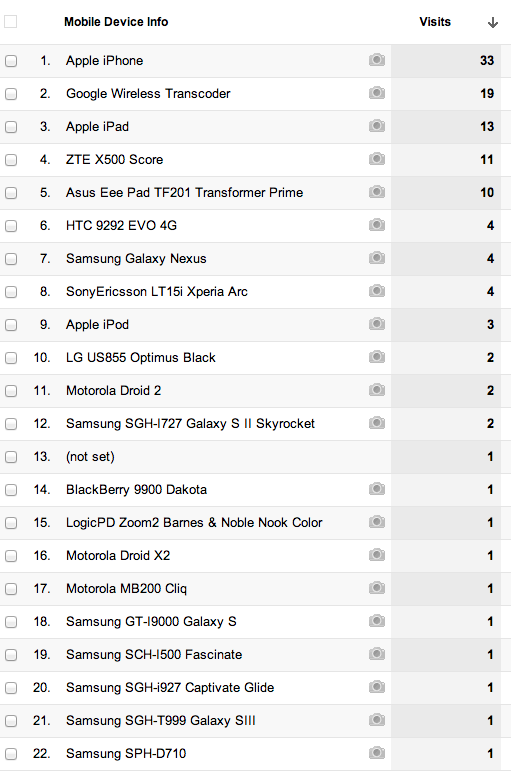
List of mobile devices that have visited our site between October 11 through November 10, 2012
Visitors from various countries around the world Sept. 1 – Sept 30, 2012
Visitors from various countries around the world: April 5 through May 6, 2012
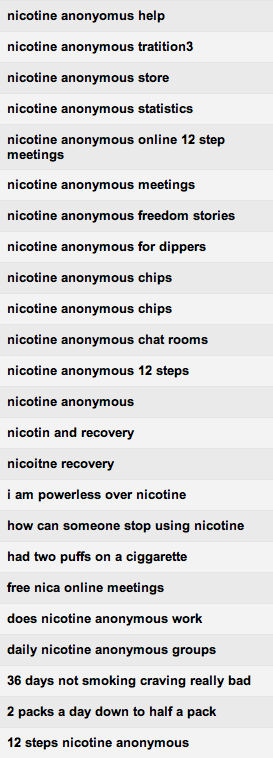
Keywords used to find us:
 |

